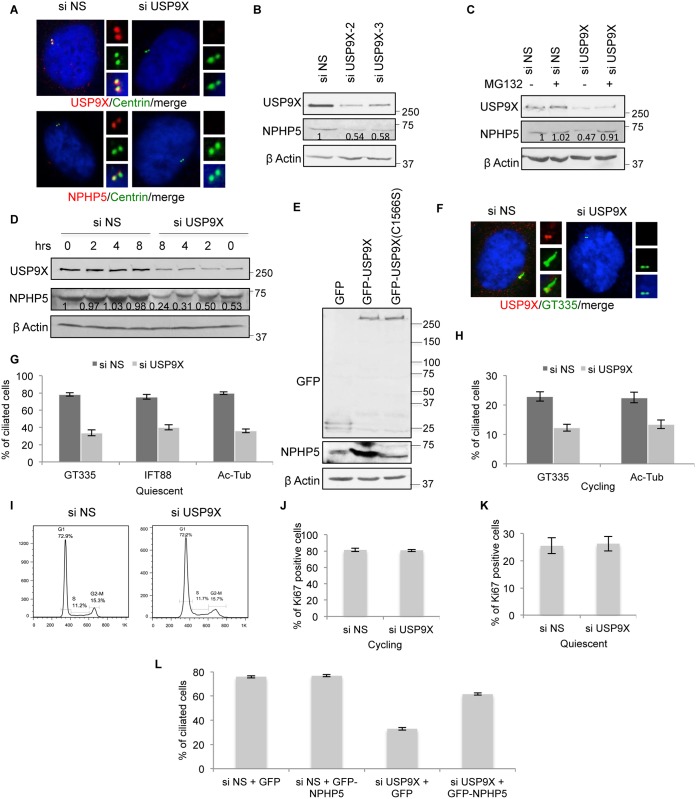
Fig 4. Effects of deregulating USP9X on NPHP5.
A) RPE-1 cells transfected with control (NS) or USP9X siRNA and stained with antibodies against USP9X or NPHP5 (red) and centrin (green). DNA was stained with DAPI (blue). B) HEK293 cells were transfected with control (NS) or USP9X siRNA. Lysates were Western blotted with the indicated antibodies. β actin was used as a loading control. Numbers indicate NPHP5 protein levels relative to control. C) HEK293 cells were transfected with control (NS) or USP9X siRNA and treated with or without MG132. Lysates were Western blotted with the indicated antibodies. β actin was used as a loading control. Numbers indicate NPHP5 protein levels relative to control without MG132 treatment. D) HEK293 cells were transfected with control (NS) or USP9X siRNA and treated with cycloheximide for the indicated number of hours (hrs). Lysates were Western blotted with the indicated antibodies. β actin was used as a loading control. Numbers indicate NPHP5 protein levels relative to control at time zero. E) HEK293 cells were transfected with GFP, GFP-USP9X wild type or mutant (C1566S). Lysates were Western blotted with the indicated antibodies. β actin was used as a loading control. F) RPE-1 cells were transfected with control (NS) or USP9X siRNA, induced to quiescence, and stained with antibodies against USP9X (red) and glutamylated tubulin (GT335; green), and with DAPI (blue). G-H) The percentage of control (NS) or USP9X siRNA-treated cycling or quiescent RPE-1 cells with cilia was determined. Cilia were stained with glutamylated tubulin (GT335), acetylated tubulin (Ac-Tub) or IFT88. I) Fluorescence-activated cell sorting analysis of cycling RPE-1 cells treated with control (NS) or USP9X siRNA. J-K) The percentage of control (NS) or USP9X siRNA-treated RPE-1 cells stained positive for Ki67 was determined. L) RPE-1 cells transfected with control (NS) or USP9X siRNA and plasmid expressing GFP or GFP-NPHP5 were induced to quiescence. The percentage of GFP positive cells with cilia was determined. In G, H, J, K, L), at least 100 cells were counted per condition, and error bars represent average of three independent experiments.

