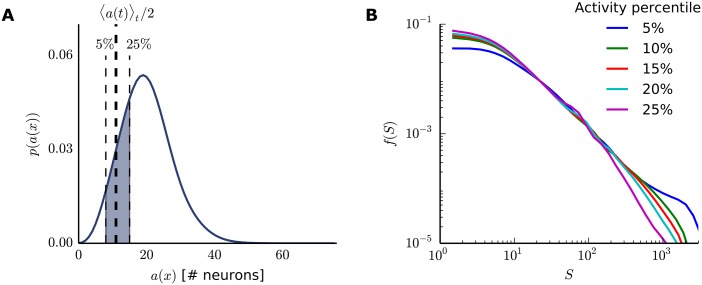
Fig 3. Robustness to choice of activity threshold.
(A) Activity distribution function for a SORN with NE = 200. The shaded area shows the approximate region where the power-laws hold. The activity peak, as expected due to the target firing rate, is 10% of the number of excitatory neurons. (B) Avalanche size distribution for different activity thresholds θ set as activity percentiles. Although showing different exponents, the power-laws hold for different thresholds (as seen, for example, for θ set at the 5th or 10th percentiles of the activity distribution). Curves show combined data from 50 simulations.

