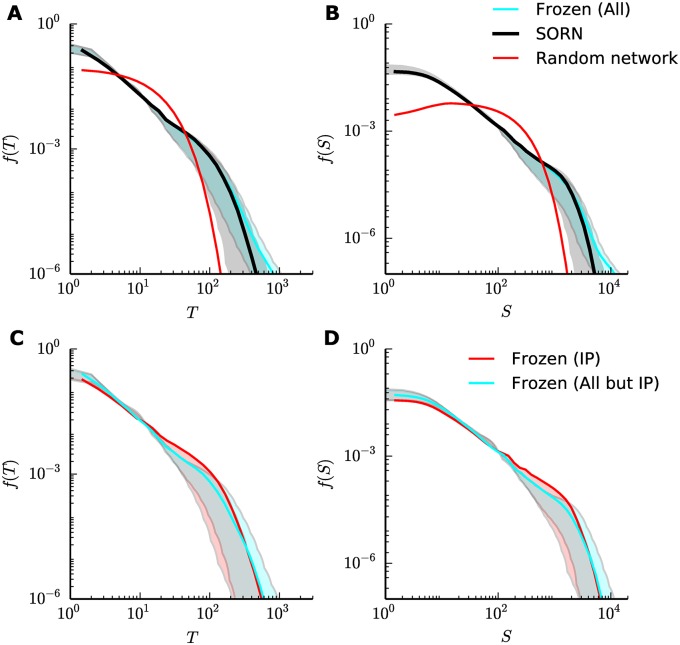
Fig 4. SORN with frozen plasticity.
(A), (B) Distribution of avalanche durations and sizes, respectively, for NE = 200 units, comparing typical SORNs (black), randomly initialized SORNs without plasticity action (red) and SORNs with all five plasticity mechanisms frozen at the stable phase (cyan). (C), (D) Distribution of avalanche durations and sizes, respectively, for the same network size, comparing SORNs with frozen IP (red) and frozen STDP, iSTDP, SN and SP (cyan) at the stable phase. Curves are combined data from 50 independent simulations, and shaded regions show the effects of variations in the activity threshold (θ between the 5th and 25th percentiles of the activity distribution).

