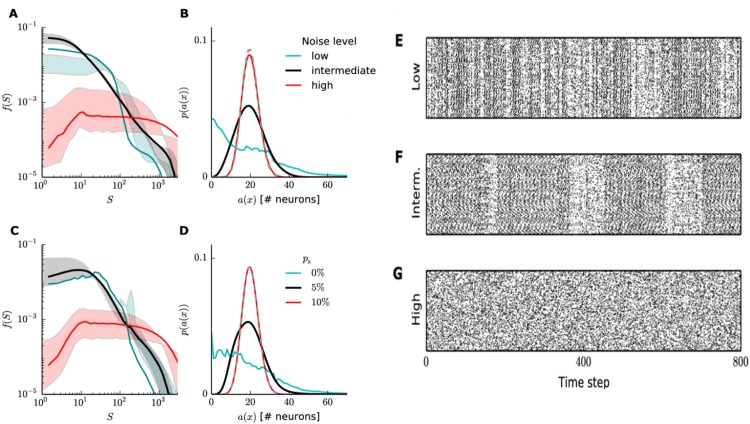
Fig 5. Noise level influences the SORN dynamical regime.
Left, top row: avalanches’ size (A) and activity (B) distributions for SORN with different Gaussian noise levels: low (σ2 = 0.005), intermediate (σ2 = 0.05) and high (σ2 = 5). Very weak or strong noise levels break down the power-laws, suggesting a different non-critical regime. Left, bottom row: Avalanches’ size (C) and activity (D) distributions for the random spike noise source (see text), showing a similar effect. Gray dashed lines are binomial distributions (n = NE = 200, p = μIP = 0.1), the theoretical prediction for independent neurons, and shaded areas show the effects of variations in the activity threshold (θ between the 5th and 25th percentiles of the activity distribution). All curves show combined data of 50 independent simulations. (E), (F), (G) Typical raster plots of excitatory unit activity at low, intermediate and high Gaussian noise levels, respectively, for NE = 200.

