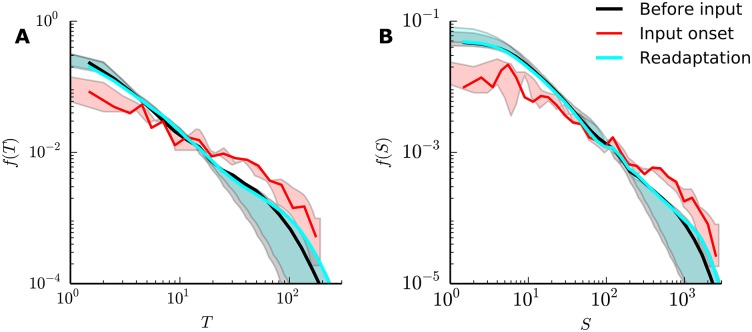
Fig 6. SORN readaptation under external input.
(A), (B) Duration and size distributions, respectively, after external input onset: transient readaptation period (red) and remaining 2 × 10⁶ time steps (cyan). Before input and Readaptation curves show combined data from 50 independent simulations. Input onset curves show data from 250 input onset trials, and shaded regions show the effects of variations in the activity threshold (θ between the 5th and 25th percentiles of the activity distribution).

