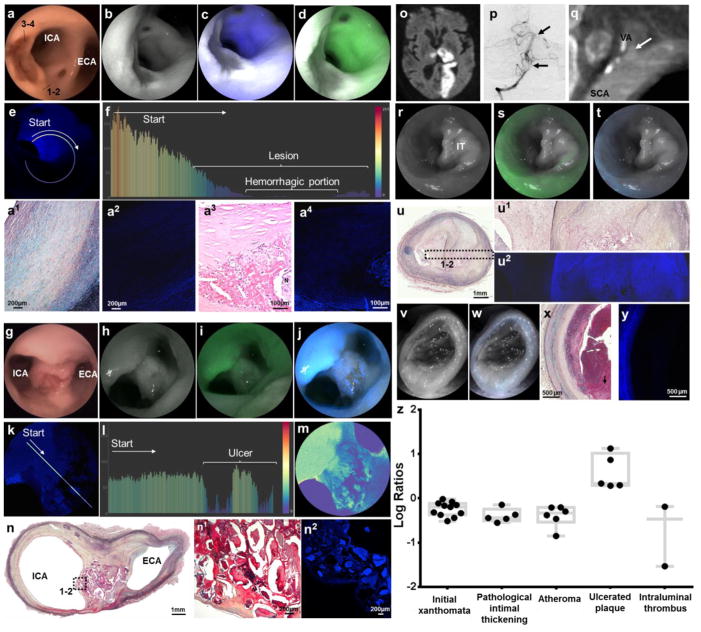
Figure 4. Multimodal endovascular SFA of complicated plaques.
a–e, Intraplaque Hemorrhage: Large elevated lesions associated with very poor blue and green autofluorescence, better appreciated in distance-compensated fluorescence image. Note the distinct reddish-brown central portion on white light, corresponding to the very low reflectance area (dark grey area, b–d). f, Color-coded bar chart of pixel values of a line traced in (e) reveals >200-point drop of autofluorescence signal down to undetectable levels in the hemorrhagic component. a1, Histological analysis of the plaque portion with preserved reflectance and decreased autofluorescence [dotted line, area 1–2 in (a)] reveals a thick layer of smooth muscle cells in a collagenous proteoglycan matrix covering a lipid or necrotic core consistent with a fibrotic atheroma (Grade IV, Movat’s stain). a2, Confocal microscopy of consecutive tissue section revealed low autofluorescence derived from the fibroatheroma, compared to the intense autofluorescence originating from elastin in the tunica media. a3, Histological analysis of the plaque portion with low reflectance and autofluorescence [dotted line, area 3–4 in (a)] reveals a complex atheroma with recent intraplaque hemorrhage (hematoxylin and eosin stain). a4, Confocal microscopy of a magnified section of the complex fibroatheroma reveals strong autofluorescence from tunica media, low autofluorescence from fibrotic cap, and negligible autofluorescence from intraplaque hemorrhage forming a black halo around a necrotic core with heterogeneous autofluorescence. g–n, Ulcerated Plaque: Punched-out lesion with irregular elevated borders at the carotid bifurcation on (g) white-light system, (h) red reflectance, and reflectance with (i) green and (j) blue channels, better appreciated in (k) distance-compensated image. Note the speckled pattern in the crater of the ulcer with multiple irregular dots of strong autofluorescence in a background of very low autofluorescence. l, The normalized pixel fluorescence difference is >75 points as demonstrated in color-coded bar chart of the line traced in (k). m, The speckled pattern can be better appreciated in pseudocolor image. n, Histological analysis of axial cut at the bifurcation reveals an atherosclerotic plaque (Movat’s stain; higher magnification in n1) with necrotic debris, some of which appears calcified, with (n2) highly heterogenous autofluorescence signal on confocal microscopy. o–y, Ruptured Plaque with Intraluminal Thrombus: Left subclavian artery (SCA) and left vertebral artery (VA) of a man with a large left-sided stroke [(o) brain MRI] secondary to artery-to-artery embolic occlusion of distal left vertebral artery and basilar artery [(p) arrows in anteroposterior cerebral angiogram]. q, Computed tomographic angiography showed atherosclerotic plaque at origin of the vertebral artery, associated with extensive luminal defect likely caused by thrombus (arrow). At time of autopsy, left subclavian artery and vertebral artery were harvested and multimodal endovascular scanning fiber angiography was performed. r–t, A sub-occlusive lesion with preserved reflectance and minimal fluorescence was found to extend distally into vertebral artery. u&u1, Histological analysis revealed an organized chronic intraluminal thrombus associated with a complicated plaque [(u) Movat’s pentachrome, and (u1) high magnification insert], with significant intraplaque vascularization, commonly resulting from organized thrombus/hemorrhage. u2, The thrombus has very low autofluorescence on confocal microscopy in comparison with the underlying fibroatheroma. v–w, Scanning fiber angiography analysis of distal vertebral artery revealed an occlusive lesion with negligible reflectance and autofluorescence. x–y, This corresponded to acute intraluminal thrombus with absent fluorescence signal on confocal microscopy. z, In the boxplot ANOVA model for log-transformed fluorescent target-to-background ratio comparison between different pathological diagnoses, all diagnoses had target-to-background ratios <0 except ulcerated plaque.

