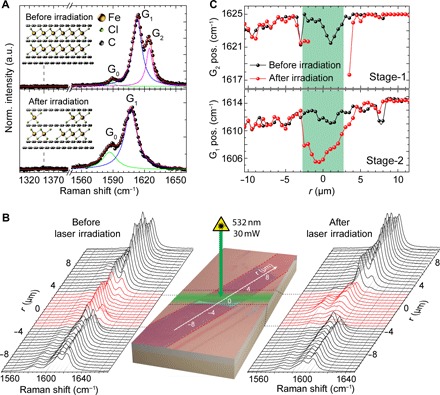
Fig. 1. Raman spectroscopy study of structural changes in laser-irradiated FeCl3-FLG.

(A) G bands in FeCl3-FLG before (top) and after (bottom) exposure to a 30-mW laser for 3 s (λ = 532 nm). Experimental data (black dots) is shown alongside a superposition of Lorentzian fits to the G0, G1, and G2 peaks (red line). (B) Optical micrograph of the FeCl3-FLG flake (red dotted lines) with the laser-irradiated region highlighted (green). Raman spectra are acquired along r before (left) and after (right) FeCl3 displacement. (C) G1 (bottom) and G2 (top) peak positions representing stages 1 and 2 intercalated states, respectively. Data points are Lorentzian fits of the spectral peaks in (B).
