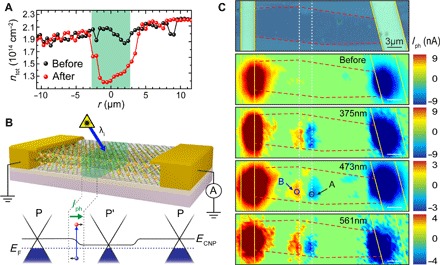
Fig. 2. Scanning photocurrent microscopy of p-p′ junctions in FeCl3-FLG.

(A) Total charge carrier concentration before and after laser-assisted displacement of FeCl3, estimated from G peak positions in Fig. 1C. (B) Short-circuit configuration (top) for scanning photocurrent measurements of a p-p′-p junction (p-p′ region in green). Schematic band structure (bottom) of each region shows photogenerated carriers drifting under a chemical potential gradient. (C) Optical micrograph (top) of an FeCl3-FLG flake (red dashed lines) with Au contacts (yellow lines). Scanning photocurrent maps (bottom) before and after selective laser-assisted displacement of FeCl3 (white dashed lines). The photoresponse is measured for excitation wavelengths of 375, 473, and 561 nm.
