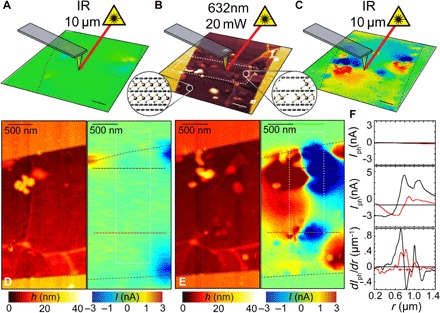
Fig. 4. High-resolution photoactive junctions in FeCl3-FLG defined using near-field scanning microscopy.

(A) Spatial map of photocurrent in a uniformly doped graphene flake before laser-assisted deintercalation. (B) AFM topography and (C) scanning photocurrent maps of the FeCl3-FLG flake after laser-assisted deintercalation by a λ = 632 nm laser scanned over a 500-nm long region (white dashed lines). Insets: Illustrations of the chemical structure in p- and p′-doped regions. Schematic of the excitation wavelength focused on a metallized AFM tip in each measurement are included in (A) to (C); outlines of the flake are superimposed (black dashed lines). Scale bars, 500 nm. Magnified concurrent AFM topography and scanning photocurrent maps are shown before (D) and after (E) laser writing. (F) Line scans of photocurrent measured across laser-defined p-p′-p junctions [(D) and (E), red and black dashed lines] before (top) and after (middle) displacement of molecules. First-derivative plots of the photocurrent signal after displacement (bottom) show a peak-to-peak distance of 250 nm between adjacent p-p′ junctions (red arrows). All photocurrent measurements were taken in short-circuit configuration.
