
Fig. 3. Single-molecule DNA-XPA dynamics.
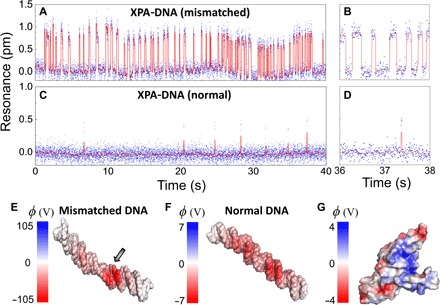
(A and B) Real-time binding dynamics of the mismatched dsDNA and XPA in the standard binding buffer, measured by tracking the resonances of the antenna-in-a-nanocavity system. The dsDNA concentration in the microfluidic channel is 10 nM. The binding kinetics are fitted from the event histogram (fig. S5): kon = 0.20 ± 0.04 nM−1 s−1 and koff = 5.0 ± 1.1 s−1. (C and D) Resonance signals tracked in real time for the normal dsDNA and XPA as control. The mismatched dsDNA exhibits much longer residence time on the binding state than the normal dsDNA. (E to G) The solvent-accessible surface potential (φ = kBT/e) of a mismatched dsDNA (E), a normal dsDNA (F), and an XPA protein (G) obtained from MD simulation. Mismatched dsDNA has a significantly higher surface potential, with an abnormal twist at the mismatched site (indicated by the arrow). Blue-colored regions on the XPA protein are positively charged domains, which bind to the negatively charged dsDNA.