
Fig. 1. Nights of insufficient sleep increase with nighttime temperature anomalies.
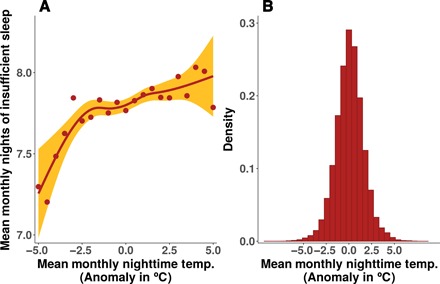
(A) Relationship between average monthly nighttime temperature anomalies and 765,000 respondents’ reported number of monthly nights with insufficient sleep from 2002 to 2011. As temperature anomalies become more positive, nights with insufficient sleep become more frequent. Points represent the average of respondents’ monthly number of nights with insufficient sleep for each 0.5°C nighttime temperature anomaly bin. The line represents a smoothing of the raw data using a cubic spline fit. Shaded error bounds represent the 95% confidence interval of this fit. (B) Distribution of 2002–2011 average monthly nighttime temperature anomalies from the daily nighttime temperature normals of 1981–2010.