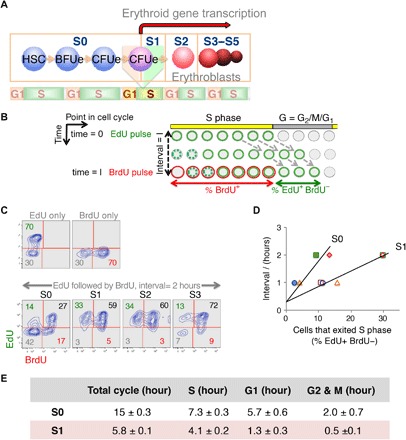
Fig. 1. S-phase shortening at the transition from self-renewal to differentiation in vivo.

(A) Schematic depicting sequential flow cytometric fetal liver subsets S0 to S5 during erythroid differentiation (see flow cytometric profile in fig. S1A). Seventy percent of S0 and all of S1 cells have CFUe potential. The transition from S0 to S1 marks a switch from CFUe self-renewal to differentiation. The S0/S1 switch is S phase–dependent and takes place in the early S phase of the last CFUe generation (23). (B) Double-deoxynucleoside label approach. Pregnant female mice were injected with EdU at t = 0 and with BrdU following a time interval I. Fetal livers were harvested and analyzed shortly after the BrdU pulse. Cells in S phase of the cycle at the time of the EdU pulse incorporate EdU into their DNA and retain this label as they progress through the cycle (represented as green cells). Cells entering S phase continue to take up EdU during the interval I, until EdU is cleared from the blood (shown as dashed green circles). Similarly, cells that are in S phase during the BrdU pulse become labeled with BrdU (red). The “green only” cells (EdU+BrdU−) represent cells that were in S phase during the first EdU pulse but have exited S phase during the interval I. This cell fraction f is proportional to the length of the interval I, as long as I is shorter than the gap phase (G2 + M + G1). By trial and error, we found that, for I to be shorter than the gap phase of S1 cells, it needs to be ≤2 hours. The linear relationship between I and f can be expressed in terms of the cell cycle length I/Tc = f, where f is the cells that exited S phase in interval I [measured as % (EdU+BrdU−) cells], I is the interval between EdU and BrdU pulses, and Tc is the cell cycle length. This relationship gives the length of the cycle as Tc = I/f. The length of S phase, Ts, can then be calculated from fraction s, of all cycling cells that take up the BrdU label (%BrdU+), as Ts = s × Tc. In preliminary experiments, we used longer BrdU pulses. These showed that nearly all cells were labeled with BrdU, suggesting that essentially all cells are cycling. Therefore, we made no corrections for the fraction of cycling cells. (C) Representative experiment as described in (B). Pregnant female mice were pulsed with EdU, followed by a BrdU pulse after an interval of 2 hours. Upper two panels show fetal liver cells from mice that were pulsed only with EdU, or only with BrdU, but processed for labeling for both deoxynucleosides in the same way as the double-labeled mice. Lower panels show EdU and BrdU labeling in fetal liver subsets that were explanted after the second pulse, sorted by flow cytometry, and then each processed for EdU and BrdU incorporation. In this specific experiment, a third of all S1 and S2 cells exited S phase in a 2-hour interval, giving a cell cycle length of 2/0.33 = 6 hours; only 14% of S0 exited S phase in the same time interval, giving a cell cycle length of 2/0.14 = 14.3 hours. Because 64% of S1 and 44% of S0 cells are BrdU+, their S-phase lengths are 0.64 × 6 = 3.84 hours and 0.44 × 14.3 = 6.3 hours, respectively. (D) Summary of five independent experiments as described above. The linear relationship between I and the cells that exited S phase, f, allows calculation of a mean cycle and length. S1, empty symbols; S0, filled symbols. r2 = 0.95 for S1 and 0.85 for S0. Results in table are mean ± SE. Pulses were reversed (BrdU first, EdU second) in one experiment, without effect on results (included here). The y axis intercepts are not at 0 because it takes approximately 20 min for peak absorption of each deoxynucleoside (fetal livers are explanted 20 min after the second injection). (E) Durations of cell cycle and cell cycle phases. The length of each cell cycle phase was calculated by multiplying the fraction of cells in each cell cycle phase following the second pulse by the total cell cycle length [measured as in (D)].
