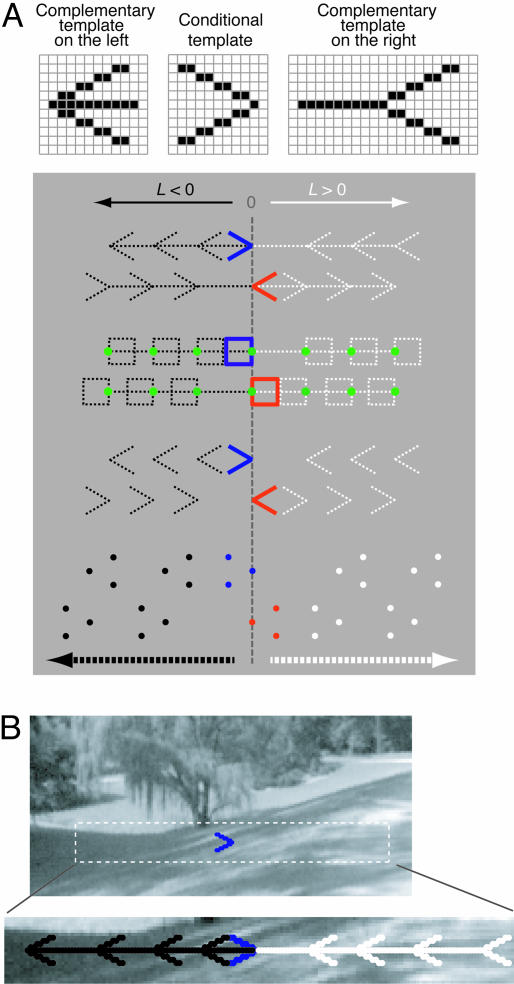
Fig. 2.
Sampling the range image database. (A Upper) The pixels in an image are diagrammatically represented by the grid squares; the black pixels show examples of the templates for sampling different elements of the standard Müller-Lyer figure. (A Lower) Each row illustrates a conditional template (blue or red) used in the first step of the sampling procedure, and a series of complementary templates (black or white) applied to the image as a next step (only a few examples in the series actually applied are shown). The green dots indicate the reference edge of a square adornment; L is the length of the central shaft or interval. (B) The sampling procedure applied to a typical image. The blue template indicates a conditional adornment sample that met the geometrical criterion described in Methods; a series of complementary templates was then overlaid at successively greater distances from the conditional adornment, as indicated in Lower.

