Fig. 3.
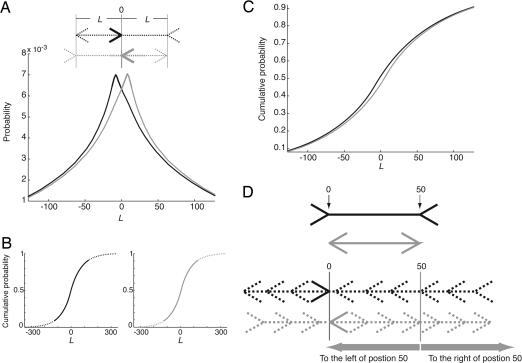
Statistical analysis of the fully natural scenes in the range-image database for the standard Müller-Lyer stimulus. (A) Probability distributions of the physical sources of Müller-Lyer figures with various shaft lengths (L, in pixels), given the presence of a conditional adornment with its apex pointing either to the right (black) or to the left (gray). In the diagram above, the conditional adornments are indicated by solid lines and the complementary components by dotted lines. (B) The cumulative probability distributions derived from the probability distributions in A. The dotted parts of the curves were computed by extrapolation. (C) Superimposition of the two functions in B.(D) Examples of two shafts 50 pixels in length, one adorned with arrow tails and the other with arrowheads (Upper). The left adornments are arbitrarily designated the conditional adornments and are indicated by solid lines at position 0 (Lower). Given each of these conditional adornments, the probability distributions shown in A–C indicate that the complementary adornment and shaft (dotted lines) can occur at different positions with varying probabilities. The summed probability of occurrence of all possible complementary adornments to the left of position 50 is greater when the fins of the conditional adornment extend to the left of position 0 (black) than when they extend to the right (gray), and conversely. This statistical fact means that a complementary adornment at position 50, given a conditional adornment extending to the left of position 0, is further to the right in the empirical range of possible positions for complementary adornments than is a complementary adornment at position 50, given a conditional adornment extending to the right of position 0.

