. 2017 May 12;6:e23629. doi: 10.7554/eLife.23629

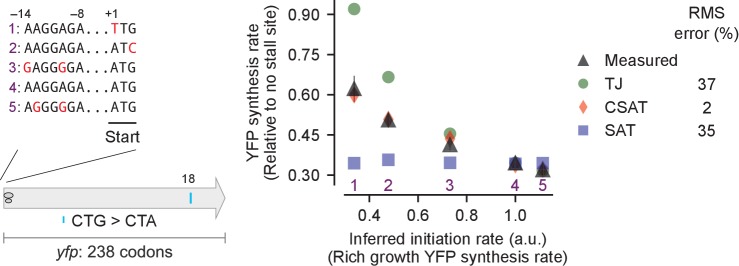
Figure 4. Predicted vs. measured YFP synthesis rates during Leu starvation upon variation in initiation rate.

yfp reporters with a single CTA codon and one of five initiation regions are shown in the schematic. X axis – Measured YFP synthesis rate during Leu-rich growth was used as a proxy for the translation initiation rate. Y axis – Predicted and measured YFP synthesis rates during Leu starvation are shown relative to a yfp mRNA without CTA codon. The Leu position 18 is labeled by its order of occurrence along yfp relative to the start codon (22 Leu codons total), and corresponds to the 201st codon in yfp. Error bars indicate standard error over triplicate cultures. Simulation parameters are shown in Supplementary file 2. RMS error % is the root mean square error between predictions from each model and measured YFP synthesis rate, normalized by the average measured value. RMS error was calculated for initiation region mutants 1, 2, 3 and 5.

DOI: http://dx.doi.org/10.7554/eLife.23629.005

Figure 4.

Figure 4—figure supplement 1. Predicted and measured YFP synthesis rates during Leu starvation (A-G) or Ser starvation (H) from yfp reporters with a single stall-inducing codon and one of five initiation region variants in Figure 4 (labeled 1–5).

Figure 4—figure supplement 1.

Each panel represents data for initiation rate variants having the indicated stall-inducing codon (Leu CTT, CTC, or CTA; Ser TCG) at one of three different Leu codon locations or one Ser codon location along yfp. The Leu or Ser positions are labeled by their order of occurrence along yfp relative to the start codon (22 Leu codons, 8 Ser codons total). The location of the sixth, 10th, and 14th Leu codons along yfp are shown in the left schematic; the fifth Ser codon is shown in the right schematic. X axis, Y axis, RMS error % and simulation parameters are as shown in the main figure.