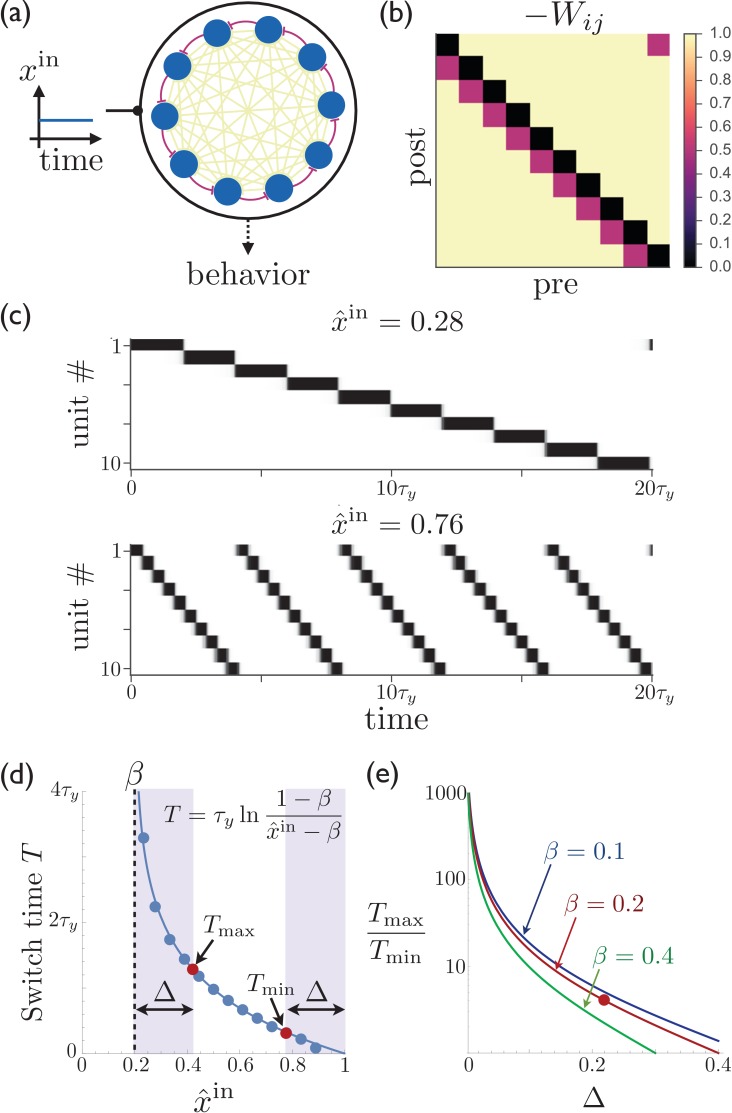
Figure 1. Rescalable sparse sequential activity in the striatum.
(a) Schematic diagram of a 10-unit striatal network. Units receive constant external excitatory input and mutually inhibit each other. The burgundy synapses correspond to a depotentiated path through the network that enables sequential activity. (b) The synaptic weight matrix for the network shown in ‘a’, with subdiagonal weights depotentiated by . (c) The magnitude of the constant input to the network can be used to control the rate at which the activity switches from one population to the next. The units in the network are active in sequential order, with the speed of the sequence increasing as the excitatory input to the network is increased. Parameters for the synaptic depression are and , the gain parameter is , synapses connecting sequentially active units are depotentiated by , and the effective input is . (d) The switch time as a function of the level input to the network. Points are determined by numerically solving Equation 1; curve is the theoretical result (equation shown in figure; see Appendix 1 for details). If the input is limited to the range (e.g. because reliable functioning in the presence of noise would require the input to stay away from the boundaries within which switching occurs), then and are the maximum and minimum possible switching periods that can be obtained. (e) The temporal scaling factor is shown as a function of for different values of the synaptic depression parameter . The red dot corresponds to the ratio of the red dots in ‘d’.

