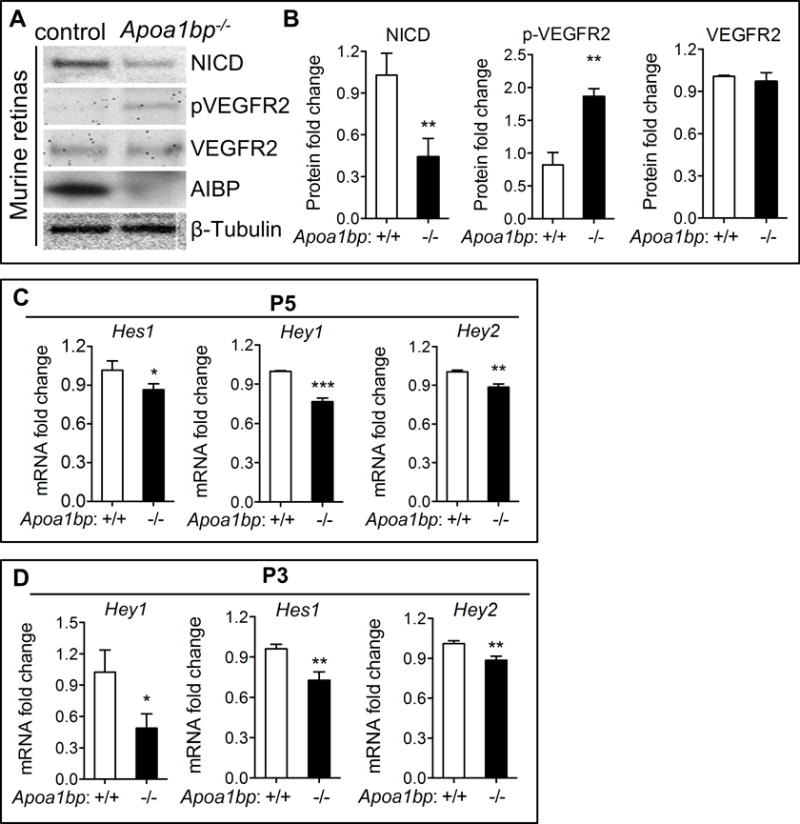
Figure 2. AIBP regulates Notch signaling in retinal angiogenesis.

(A) Western blot analysis of NICD, phospho-VEGFR2 (pVEGFR2), and total VEGFR2 in the retinas of P5 AIBP knockout neonatal mice and their control littermates. (B) Quantification of A. The Y axis showes relative protein levels of NICD normalized to β-tubulin. Quantitative RT-PCR analysis of the Notch downstream target Hey1, Hey2 and Hes1 gene expression in Apoa1bp−/− and control retinas at P5 (C) and P3 (D). Mean ± SD; n=3. *, p<0.05; **, p<0.01; ***, p<0.001.
