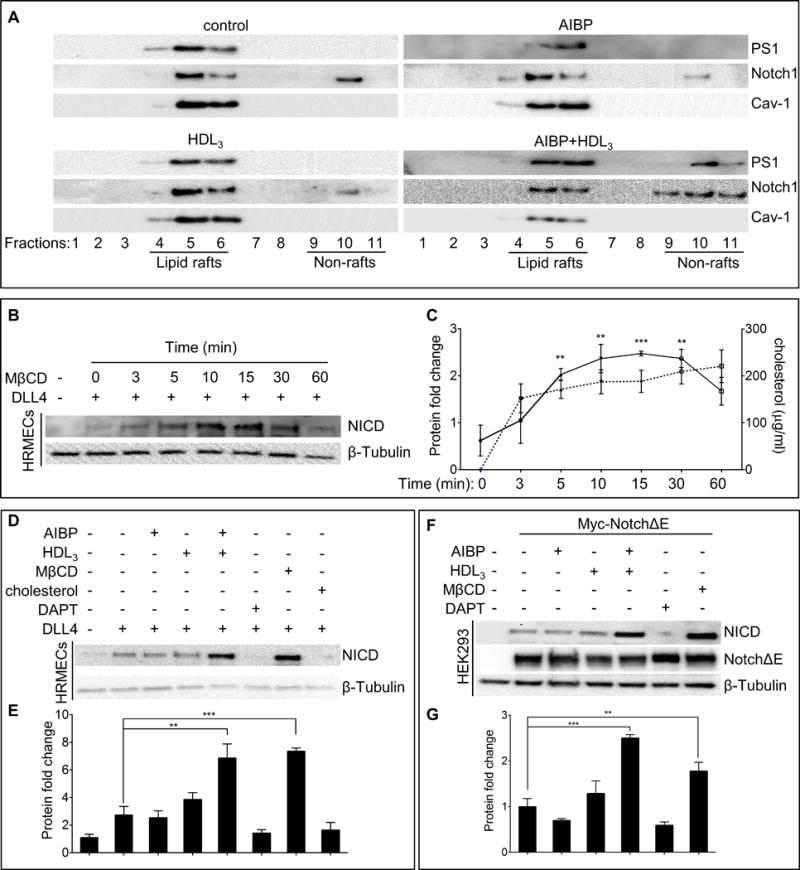
Figure 3. AIBP regulates Notch signaling through its effect on γ-secretase localization.

(A) The distribution of γ-secretase and Notch1 in lipid rafts (fractions 4–6) and non-lipid rafts (fractions 9–11). HRMECs were incubated with 0.1 μg/ml AIBP, 50 μg/ml HDL3, or their combination for 4 hours, and were disrupted and separated into lipid raft and non-lipid raft fractions by ultracentrifugation. Immunoblots of presenilin1 (PS1) and Notch1 were shown. (B) MβCD effect on Notch activation. HRMECs were seeded onto a 6-well plate precoated with or without 0.5 μg/ml recombinant DLL4 and followed by treatment with 10 mM MβCD for the indicated times. To ensure cells received equal DLL4 stimulation time, the treatment was started at different time so as to harvest the cells simultaneously for immunoblotting of NICD. (C) Quantification of NICD protein levels in B (solid line) and measurements of free cholesterol content (dash line) removed from HRMECs with MβCD treatment. (D) AIBP and HDL3 effect on Notch activation. HRMECs were seeded as in B, followed by treatment with AIBP (0.1 μg/ml), HDL3 (50 μg/ml), AIBP/HDL3 combination for 4 hours, with 20 μM DAPT (γ-secretase inhibitor) for 24 hours, with 10mM MβCD for 10 min, or with 10 μg/ml water-soluble cholesterol for 2 hours. The different treatments were started at various time so as to lyse the cells simultaneously for western blot of NICD. (E) Quantification of NICD proteins in D. (F) AIBP and HDL3 effect on γ-secretase activity in HEK293 cells. HEK293 cells were transfected with NotchΔE or a control empty plasmid. After 48 hours, the resulting cells were treated as in D and used for immunoblots as indicated. NotchΔE was detected using anti-Myc Ab. (G) Quantification of F. The relative values of NICD/NotchΔE/ β-tubulin were normalized to that of control and the resulting numbers were used to generate the graph. Mean ± SD; the experiments were done with 3 independent repeats. In all panels: **, p<0.01; ***, p<0.001.
