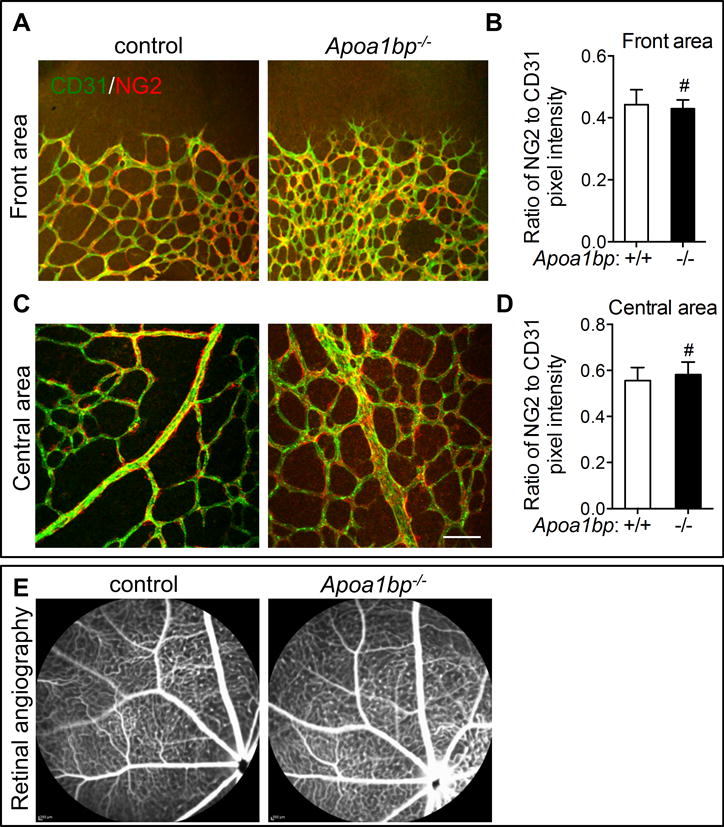
Figure 5. Vascular integrity in Apoa1bp−/− mice.

Immunostaining of CD31 (green) and NG2 (red) in the front areas (A and B) and the central area (C and D) of the retinas from P5 Apoa1bp−/− neonatal mice or their control littermates and the quantification results of NG2 fluorescence intensity (B and D). (E) Representative Fluorescein Angiography images of 10-month Apoa1bp−/− and WT littermates (n=5 for AIBP KO and n=3 for WT control). For A–D, Mean ± SD; n=3. Scale bar: 100 μm. #, not significant.
