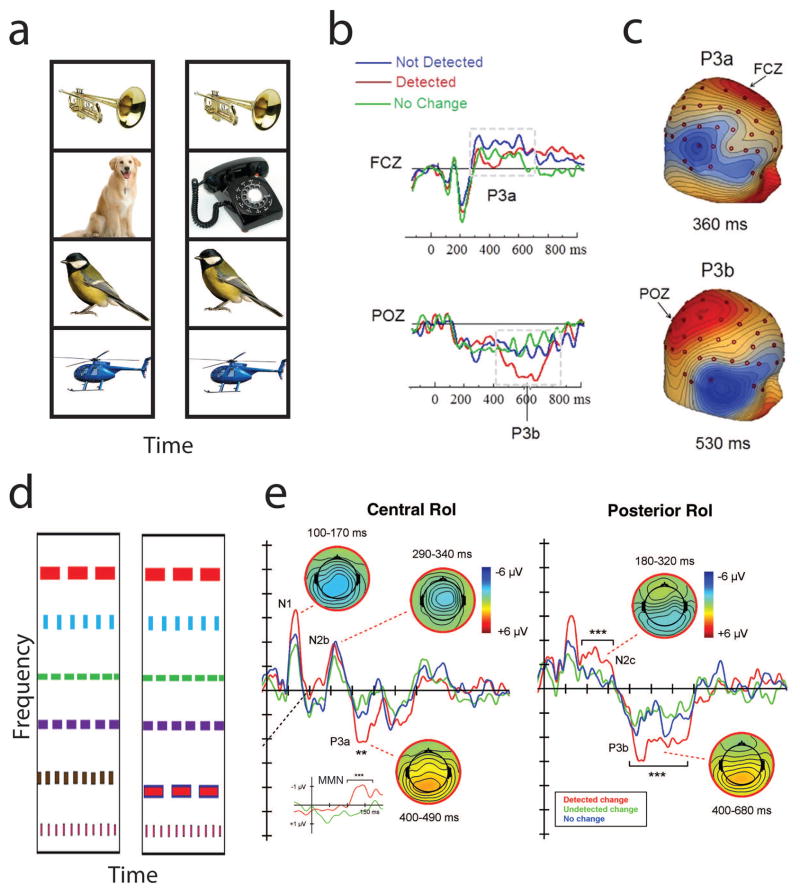
Figure 4.
(A) Schematic of recognizable sounds used in change deafness experiments. A set of sounds are played at the same time and after a brief delay, the same set of sounds are played with no change, or one of the sounds is changed (as shown with dog turning into phone ringing). (B) Electrical brain responses (reprinted from Ref. 128 with permission from Elsevier) showing P3a and P3b responses that are enhanced on trials with a detected change, compared with trials with no change or a non-detected change (note positive voltage is plotted downward). (C) Topographies of the difference between detected and non-detected changes in Ref. 128 for the P3a and P3b. (D) Schematic of bandpass noise burst patterns used in change deafness experiments, with change in second-lowest frequency pattern. (E) Electrical brain responses (reprinted from Ref. 129 with permission from Elsevier), showing several enhanced components for detected changes.

