
Figure 1. Frequencies and phenotypic characterization of myeloid progenitor cells.
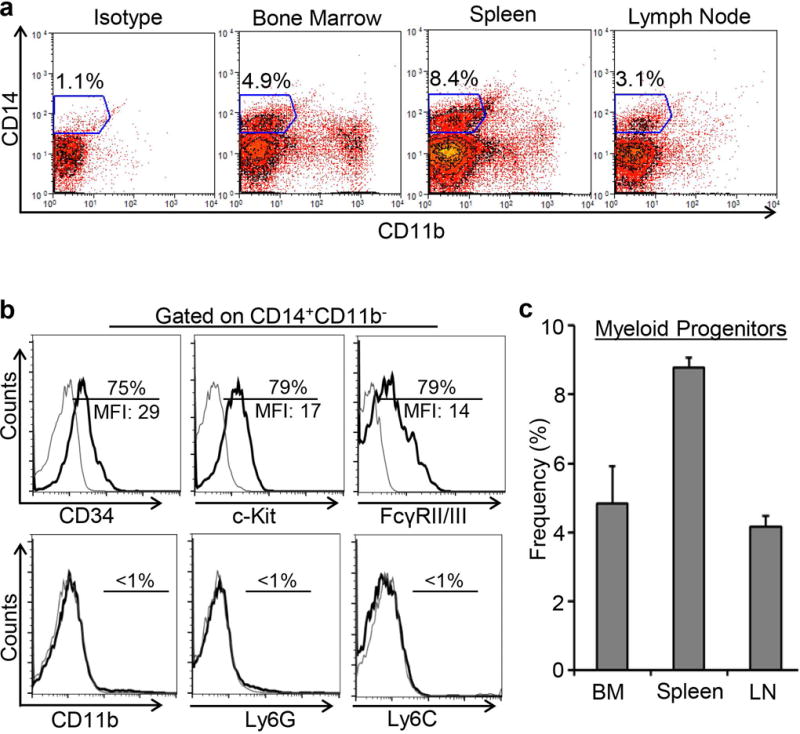
A. Representative flow cytometric dot plots showing gating strategy for selecting CD14+CD11b− cells in the bone marrow, spleen, and submandibular lymph nodes. B. Representative flow cytometric histograms demonstrating the expression of progenitor markers CD34, c-Kit and FcγRII/III, myeloid marker CD11b, monocytic marker Ly6C, and granulocytic marker Ly6G by CD14+CD11b− cells. C. Bar chart comparing the frequencies of myeloid progenitors in the bone marrow, spleen and lymph node as analyzed by flow cytometry. Representative data from 3 independent experiments are shown and each experiment consisted of 5 animals. Data is represented as mean ± SEM.