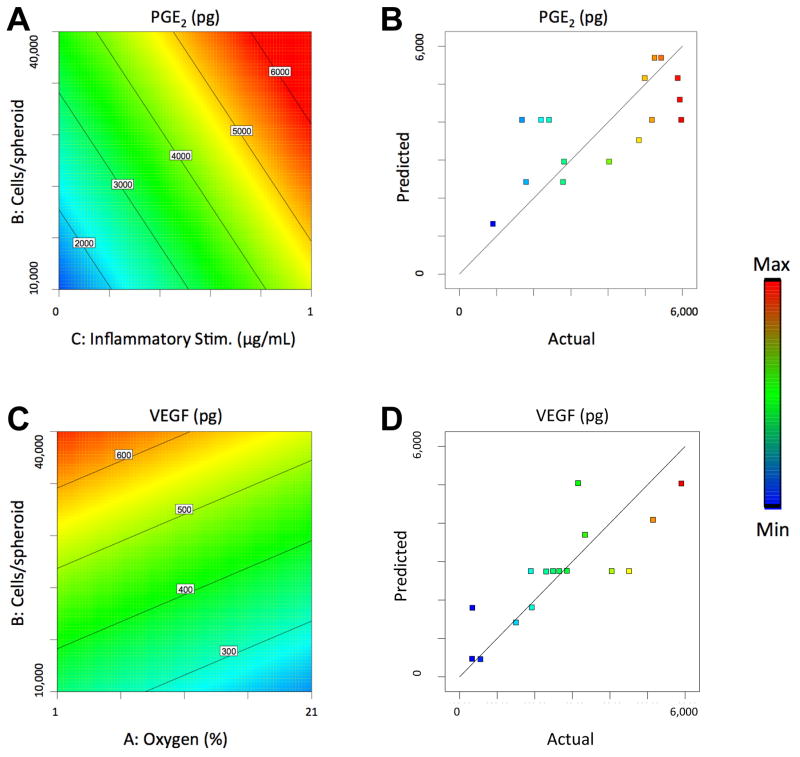
Figure 1. Response surface maps of microenvironment effects on the wound healing potential of MSC spheroids.
(A) The effect of cells/spheroid and inflammatory stimulus on PGE2 secretion by MSC spheroids. (B) PGE2 Model Fit as visualized by plotting predicted versus actual PGE2 values. (C) The effect of cells/spheroid and oxygen tension on VEGF secretion by MSC spheroids. (D) VEGF Model Fit as visualized by plotting predicted versus actual VEGF values.

