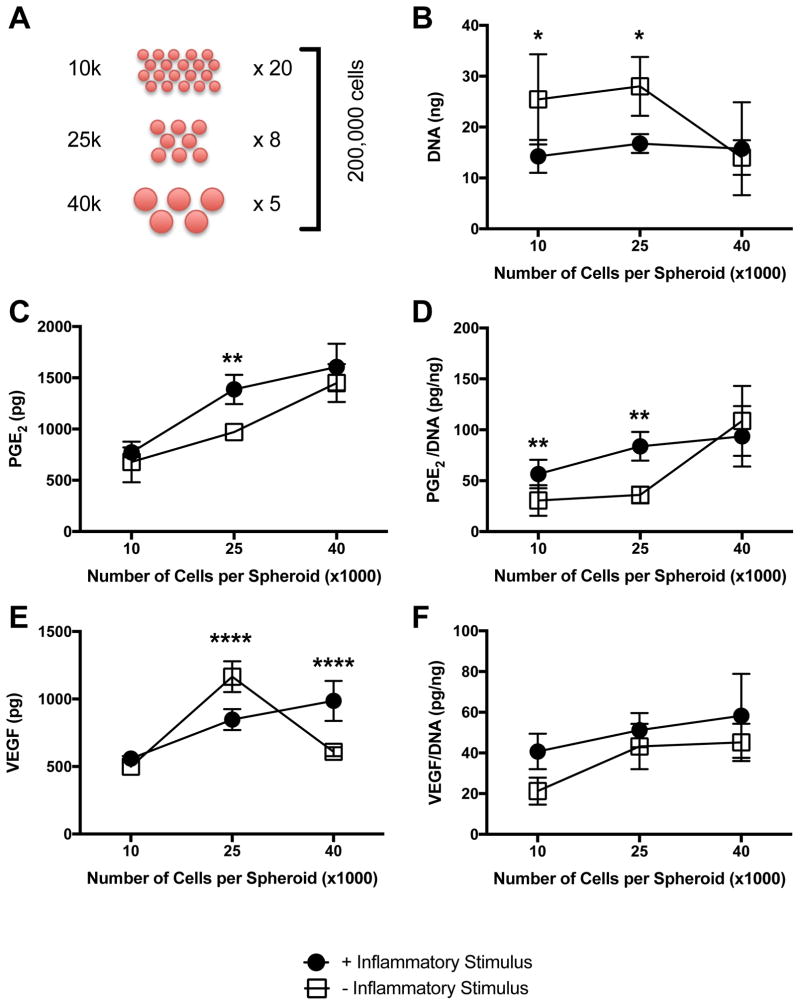
Figure 2. Secretion of proangiogenic and anti-inflammatory factors increases with spheroid size.
(A) Diagram illustrating experimental approach to assess role of MSC number per spheroid on spheroid function. (B) DNA content as a function of spheroid size and inflammatory stimulus (*p<0.05 vs. +Inflammatory Stimulus for 10,000 and 25,000 cells per spheroid). Wound healing potential as quantified by (C) Total PGE2 (**p<0.01 vs. +Inflammatory Stimulus for 25,000 cells per spheroid); and (D) normalized PGE2 (**p<0.01 vs. +Inflammatory Stimulus for 10,000 and 25,000 cells per spheroid). (E) Total VEGF (****p<0.0001 vs. +Inflammatory Stimulus for 25,000 and 40,000 cells per spheroid). (F) Normalized VEGF. All data are n=4.

