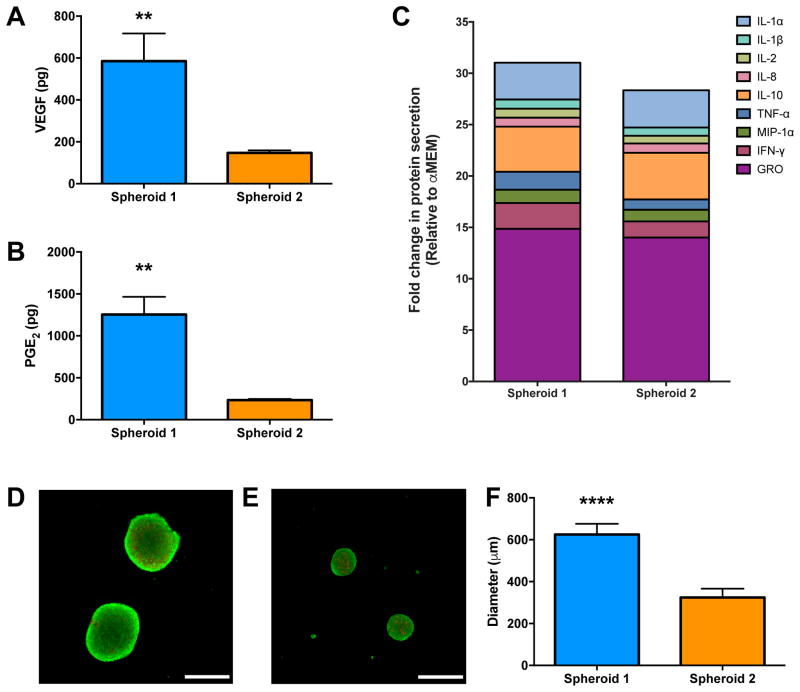
Figure 3. Validation of the DOE model using spheroids predicted to have the greatest (Spheroid 1) and least (Spheroid 2) VEGF and PGE2 production.
Spheroid 1 (40,000 MSCs/spheroid, 1 μg/mL Pam3CSK4, 1% O2) versus Spheroid 2 (10,000 MSCs/spheroid, 0 μg/mL Pam3CSK4, 21% O2). (A) VEGF and (B) PGE2 were significantly increased in Spheroid 1 versus Spheroid 2 (n=4, **p<0.01 vs. Spheroid 2). (C) Stacked column chart of predominant anti-inflammatory cytokines, normalized to unconditioned media (α-MEM). Live (green)/dead (red) assay showing the viability of (D) Spheroid 1 and (E) Spheroid 2. Scale bar represents 500 μm; images captured using a 4X objective. (F) Spheroid size is dependent upon the number of cells per spheroid (n=4, ****p<0.0001 vs. Spheroid 2).

