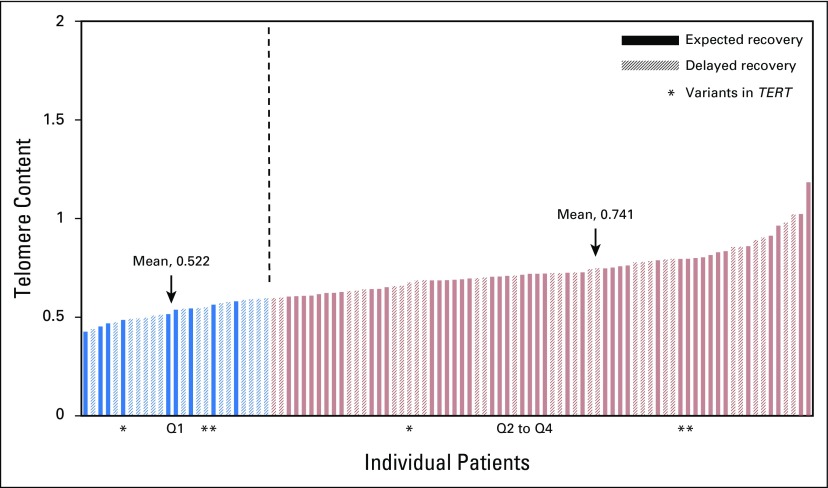
Fig 2.
Telomere content (TC) in patients with expected and delayed recovery were distributed among all four TC quartiles. TC distribution is shown from least to greatest and divided into two groups by TC: quartile one (Q1) and Q2 to Q4. The mean TC for Q1 was 0.52 (range, 0.43 to 0.59; standard deviation [SD], 0.05); for Q2 to Q4, it was 0.74 (range, 0.59 to 1.18; SD, 0.11). Vertical dashed line divides Q1 from Q2 to Q4.

