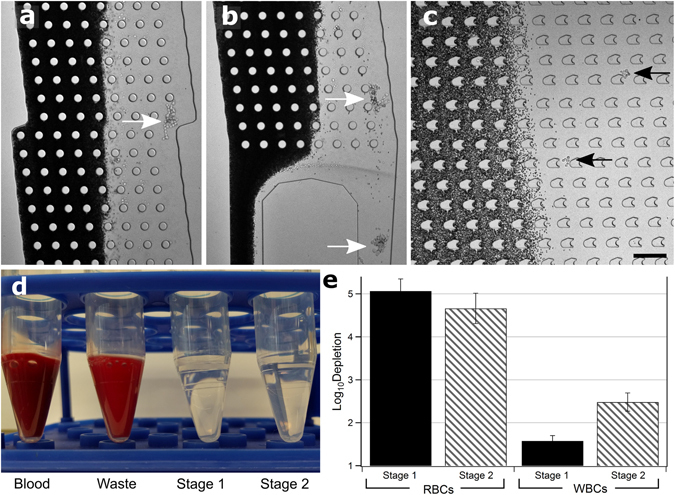
Figure 2.

Whole Blood Device Operation. (a) Photomicrograph of: mid-Stage 1 showing large cluster deflected into product stream (white arrow), (b) exit of Stage 1, two large clusters exiting into Stage 1 product (white arrows), and (c) Stage 2 showing two small clusters being deflected out of blood stream (black arrows). Red blood cells are dark. Scale bar: 200 µm. (d) Image of Blood input vs. Waste, Stage 1 and Stage 2 outputs showing red blood cell content. (e) Log (10) depletion of red blood cells and white blood cells in Stage 1 (dark) and Stage 2 (light) outputs. Experiments conducted in triplicate, error bars represent one standard deviation.
