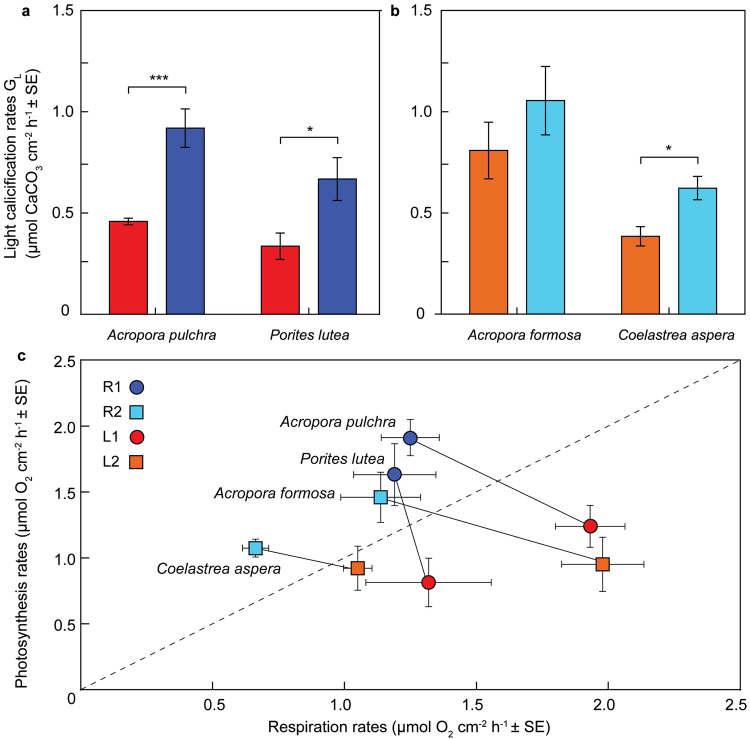
Figure 3.
Coral metabolism in the Bouraké lagoon system versus reference reef sites. (a,b) Light-driven calcification (GL) for Acropora pulchra and Porites lutea (a) at lagoon site L1 (red bars) and reference site R1 (dark blue bars), and Acropora formosa and Coelastrea aspera (b) at lagoon site L2 (orange bars) and reference site R2 (light blue bars). *p < 0.05, **p < 0.01, ***p < 0.001 between groups according to t-test analysis (n = 4 per species). (c) The metabolic comparisons of photosynthesis and respiration rates between reference sites R1, R2 versus lagoon sites L1, L2. Species-specific metabolic shifts are indicated by lines (black) and the dashed lines represent the 1:1 ratio.

