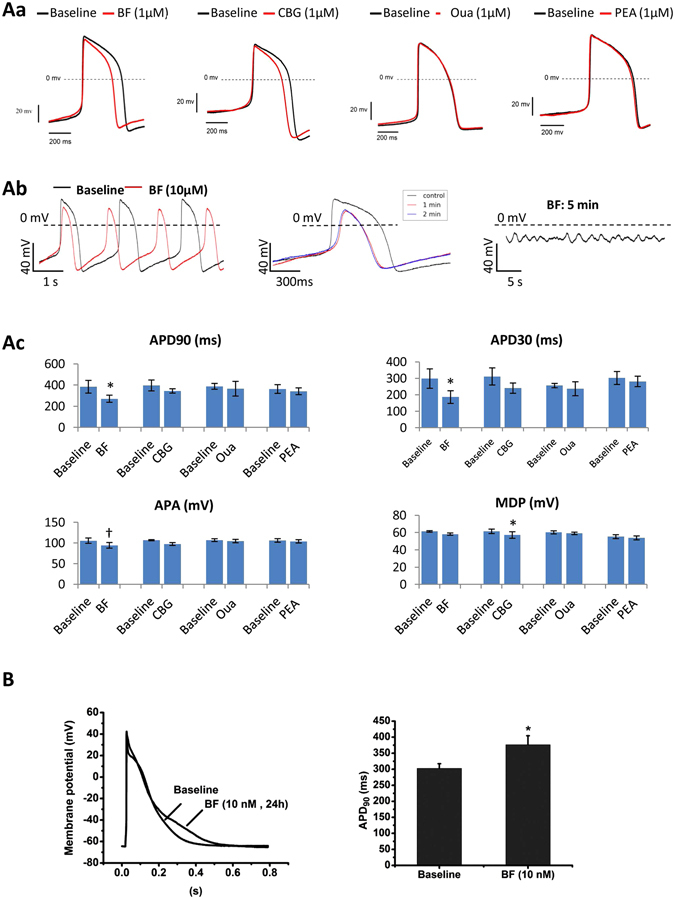
Figure 5.

Effect of CGs on APs in hESC-CMs. Effects of CGs on APs were recorded in single hESC-CMs. (Aa) Representative AP waveforms recorded in hESC-CMs exposed to 1 µM of BF, CBG, Oua and PEA for 1–2 minutes. (Ab) Representative AP waveforms recorded in hESC-CMs treated with BF (10 µM) for different time points. (Ac) Bar-graphs show APD90, APD30, APA and MDP measured in hESC-CMs 2 minutes post application of BF, CBG, Oua and PEA. * p < 0.05, † p < 0.01, vs. baseline (two-tailed paired Student t-tests). Data are presented as mean ± SEM. (B) Representative superimposed AP waveforms recorded in hESC-CMs exposed to 0.1% DMSO (as vehicle control) and BF (10 nM) for 24 hours. n = 7.
