Figure 6.

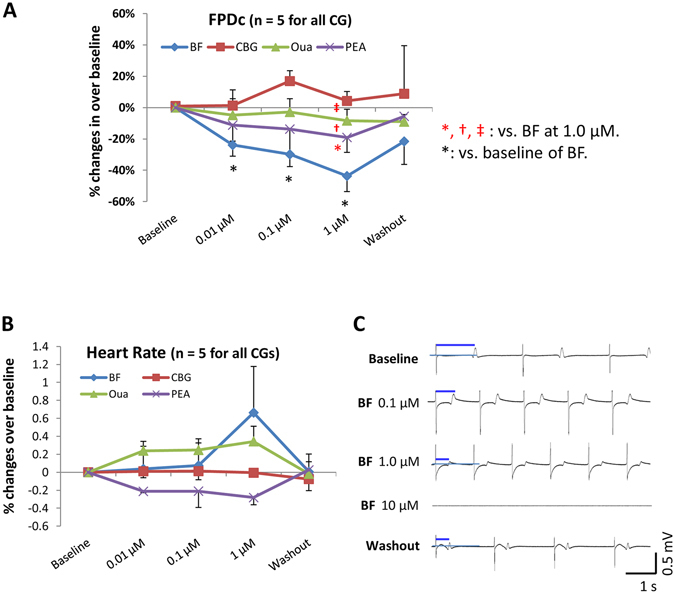
Effect of CGs on FPs in hESC-CMs. Effects of BF, CBG, Oua and PEA on cardiac FPs were recorded in clusters of hESC-CMs. (A) % changes of the FPDc over baseline. (B) % changes of the heart rate over baseline. (C) Representative FP traces show the effects of BF. All recordings were started after stabilization for 5 minutes. *p < 0.05, vs. baseline (One-Way ANOVA). *(red) p < 0.05, †(red) p < 0.01, ‡(red) p < 0.001, vs. BF (Two-Way ANOVA). Data are presented as mean ± SEM.
