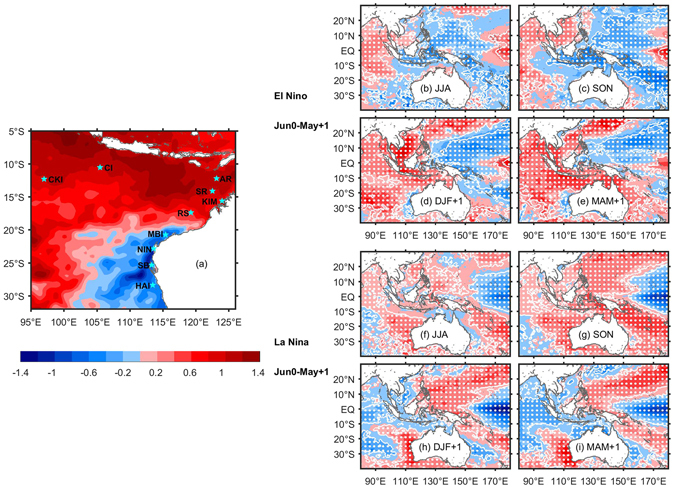
Figure 1.

(a) Averaged SST anomalies in the SEIO during December 2015-April 2016. Stars denote locations of representative SEIO reefs. (b–e) Composited SST anomalies for the El Niño events during January 1982-April 2015 and (f–i) for the La Niña events in the same time period. The white contours and dots indicate anomalies exceeding the 95% significance level based on a two-tailed Student’s t test. JJA = June to August, SON = September to November, DJF = December to February of year 1, MAM = March to May of year 1. Figures are plotted using MATLAB R2015b (http://www.mathworks.com/). The maps in this figure are generated by MATLAB R2015b with M_Map (a mapping package, http://www.eos.ubc.ca/~rich/map.html).
