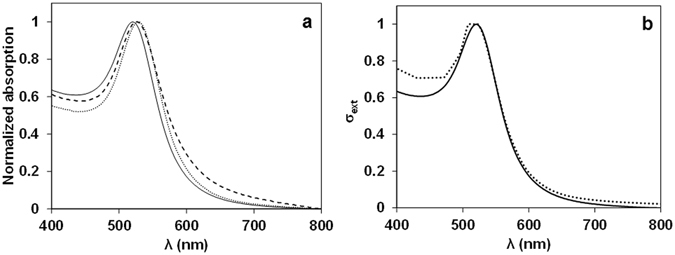
Figure 2.

(a) Normalized absorption spectra of GNPs dispersed in water (solid curve), GNP-PEG (dashed curve) and GNPSi9 (dotted curve) dispersed in ethanol. A small red shift in the surface plasmon band of the gold is observed due to the higher refractive index of amorphous silica (1.46), compared to that of ethanol (1.36) and water (1.33). (b) The extinction spectra of GNPs dispersed in water (dotted curve) corresponds to the sum of the scattering and absorption contributions and can be calculated by the Mie theory (Supporting Information, section S1). The calculated extinction cross section (σ ext) agrees with that obtained experimentally for GNPs in water (solid curve).
