Figure 4.

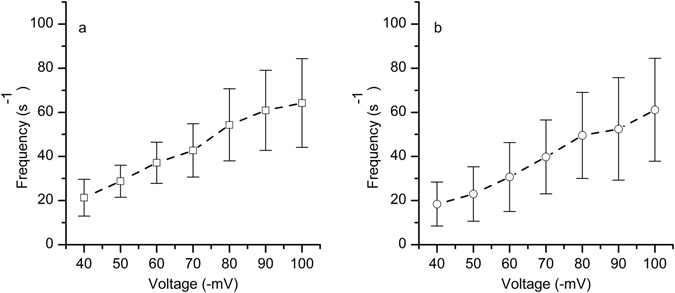
The effect of voltage on event frequency. The frequency of E1 events (a) and E2 events (b) estimated for a single lysenin channel follows the applied voltage in a quasi-linear manner. The experimental points represents mean ± s.d, n = 3.

The effect of voltage on event frequency. The frequency of E1 events (a) and E2 events (b) estimated for a single lysenin channel follows the applied voltage in a quasi-linear manner. The experimental points represents mean ± s.d, n = 3.