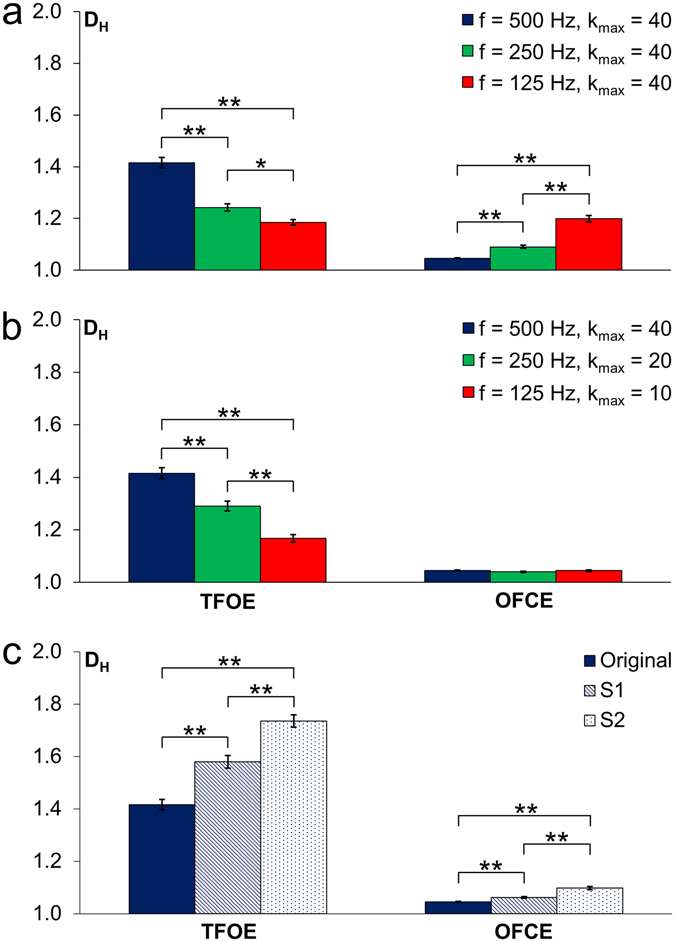
Figure 4.

Effect of sampling frequency and noise on the Higuchi dimension for S y- time signals. Left diagrams correspond to the easy task TFOE, and right diagrams correspond to the difficult task OFCE. Mean values and standard errors of means (n = 15) of the first attempt of each participant to remain standing over the full 60 s are given. Significant differences (Games-Howell, *p ≤ 0.05, and **p ≤ 0.01) are indicated. (a) Effect of sampling frequency on the Higuchi dimension. D H was computed from time signals taken with a sampling frequency of 500 Hz (blue columns) and k max was set to 40. D H-values at 250 Hz (green columns) and 125 Hz (red columns) were calculated from down-sampled signals. (b) Effects of sampling frequency and data point interval k max. Analogously to (a), but k max was matched to the sampling frequency, such that the effective time interval (0.08 s) remained constant. (c) Influence of noise on the Higuchi dimension. The blue columns again correspond to the originally measured signal (500 Hz, k max = 40), the hatched columns show D H means when artificial noise (Gaussian random noise, SD = 0.05 mm) was added to each data point of the time signal. Dotted columns show D H means when the same artificial noise was added again.
