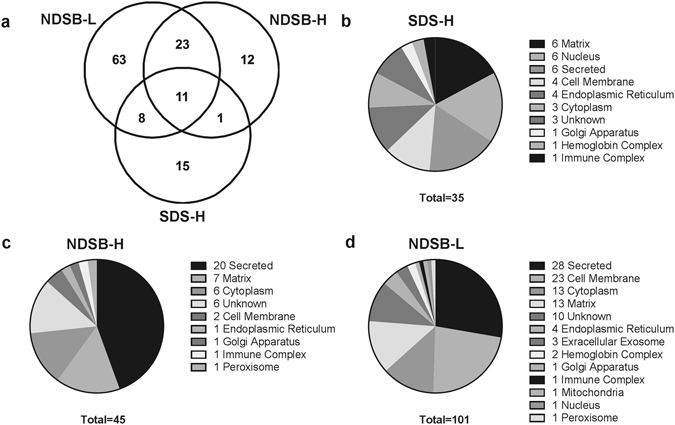
Figure 4.

Comparison of antigenic protein identifications depending on type of extraction solution, SDS-H, NDSB-H, and NDSB-L. Venn diagram showing the number of antigenic proteins identified using each protein extraction methods (a). Pie charts demonstrating subcellular location of proteins depending on the protein extraction method used (b–d). Numbers associated with subcellular locations indicate number of antigens identified within that subcellular location. (n = 6 per extraction method).
