
Fig. 1.
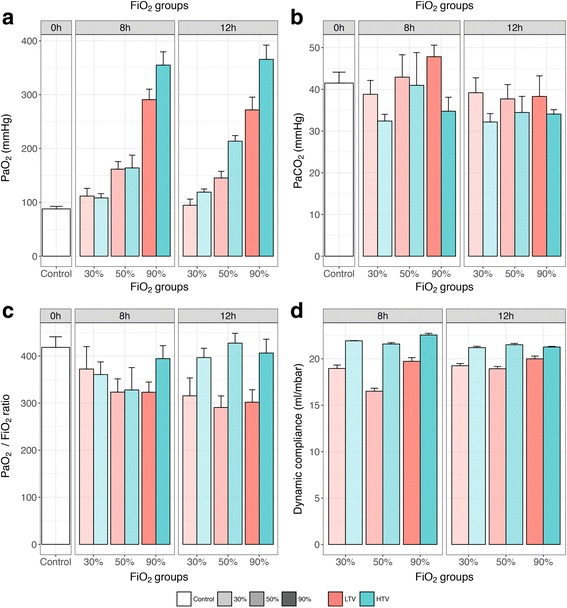
Arterial oxygenation and ventilation parameters. Data are means ± SEM. Arterial oxygenation in carotid blood (a, upper left panel), arterial carbon dioxide in carotid blood (b, upper right panel), PaO2/FiO2 ratio (c, lower left panel), and dynamic compliance (d, lower right panel). Facets within the panels represent mechanical ventilation time. Different colors represent different tidal volume groups, and different transparency levels represent different FiO2 groups. 0h no mechanical ventilation time, control group; 8h 8 h of mechanical ventilation, 12h 12 h of mechanical ventilation, LTV low tidal volumes, HTV high tidal volumes. Dynamic lung compliance (tidal volume size/(peak inspiratory pressure − PEEP) was measured hourly. PaO2 and PaCO2 were measured once in the arterial blood gas sample taken from the carotid artery at the end of the experiment