
Figure 5.
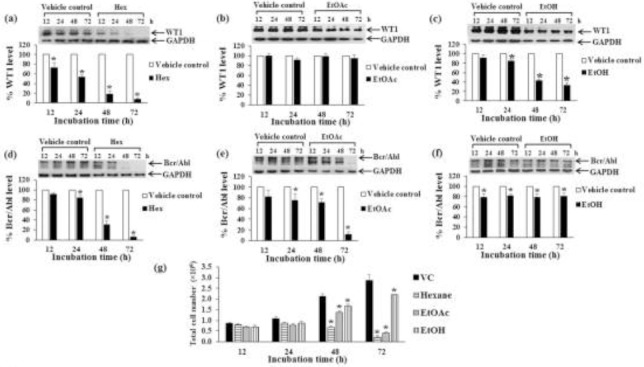
Effect of time periods of crude EtOH extract, Hex, and EtOAc fraction treatments on Bcr/Abl and WT1 protein expression in K562 cell line. K562 cells were treated with Hex fraction (a, d), EtOAc fraction (b, e), and crude EtOH extract (c, f) at the concentrations of IC20 values for 12, 24, 48, and 72 h. The levels of WT1 (a, b, c) and Bcr/Abl (d, e, f) proteins were evaluated by Western blotting; GAPDH was used as a loading control. The levels of WT1 and Bcr/Abl protein expressions were quantified by a scanning densitometer. (g) The total cell numbers after 12, 24, 48, and 72 h were determined by the trypan blue exclusion method. * denotes a significant difference from the control group (p < 0.05).