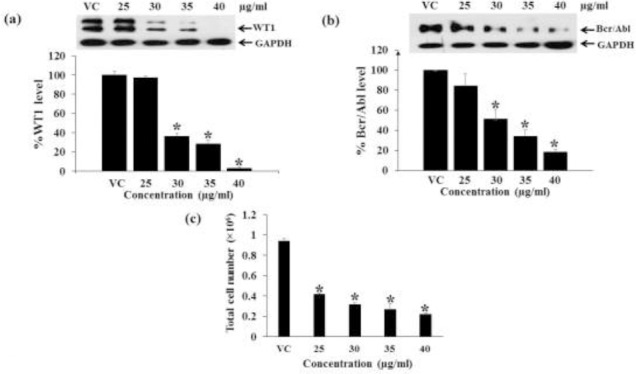
Figure 7.

Effect of dosages of the Hex fraction on WT1 and Bcr/Abl expression in K562 cells. K562 cells were treated with various doses (25, 30, 35, and 40 μg/ml) for 48 h. (a) The levels of WT1 protein expression and (b) Bcr/Abl expression after treatments were evaluated by Western blotting; GAPDH was used as a loading control. (c) The total cell numbers were determined by the trypan blue dye exclusion method. * denotes a significant difference from the control group (p < 0.05).
