Figure 1.

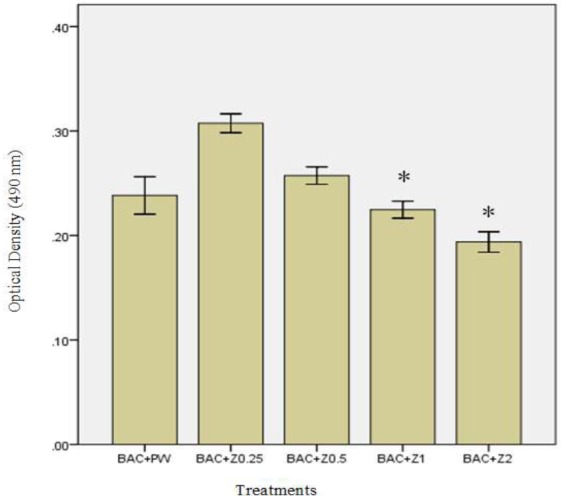
Growth of E. coli O157:H7 mixed with different concentrations of white alum during 4 hours. Error Bars display Confidence Interval for Mean. Asterisks indicate the signficance difference, compared with BAC+PW (p<0.05).

Growth of E. coli O157:H7 mixed with different concentrations of white alum during 4 hours. Error Bars display Confidence Interval for Mean. Asterisks indicate the signficance difference, compared with BAC+PW (p<0.05).