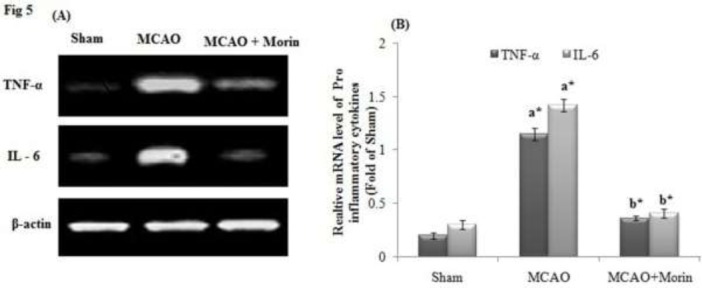
Figure 5.

Morin inhibited the cytokine mRNA expression profile in MCAO rats. β-actin served as a standard. (A) After MCAO the upregulated mRNA expression of TNF-α and IL-6 was observed and Morin treatment effectively reduced the expression. (B) Relative mRNA level of TNF-α and IL-6. Values are mean ±SD for 3 rats in each group. Comparisons are made between: (a) Sham and MCAO; (b) MCAO and MCAO +Morin. *Statistically significant (p<0.05).
