
Figure 3.
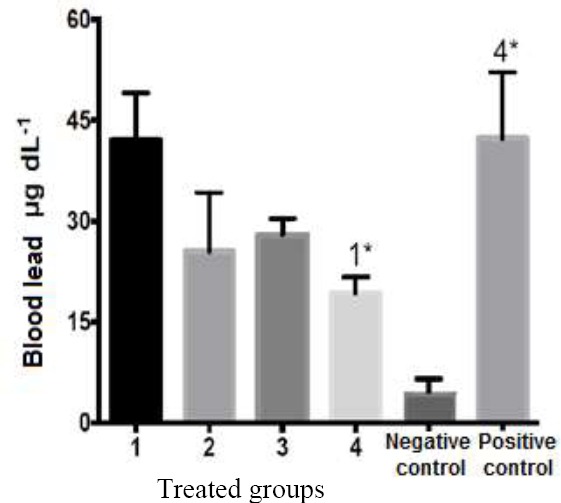
Mean concentration of lead on treatment and control groups. (*p<0.05 positive control vs group 4; *p<0.05 group 4 vs group 1).
Official websites use .gov
A
.gov website belongs to an official
government organization in the United States.
Secure .gov websites use HTTPS
A lock (
) or https:// means you've safely
connected to the .gov website. Share sensitive
information only on official, secure websites.
Mean concentration of lead on treatment and control groups. (*p<0.05 positive control vs group 4; *p<0.05 group 4 vs group 1).