Figure 5.

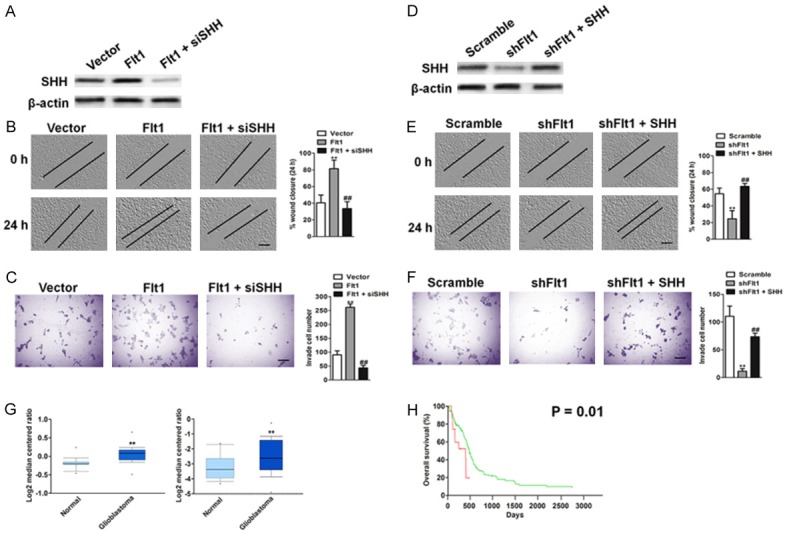
SHH knockdown decreases Flt1-mediated cell migration and invasion. (A) Flt1 overexpressing T98G cells were transfected with control shRNA or SHH siRNA. The protein level of SHH in indicated T98G cells were determined by immunoblotting analysis. Knockdown of SHH decreases cell migration (B) and invasion (C) in Flt1 overexpressing T98G cells. Scale bars, 100 μM. (D) Flt1 shRNA LNT-229 cells were transfected with control vector or SHH overexpressing plasmid. The protein level of SHH in indicated LNT-229 cells was determined by western blotting assay. (E) Ectopic expression of SHH reverses the phosphorylation of cell migration in Flt1-knockdown LNT-229 cells. Flt1-knockdown LNT-229 cells were transfected with SHH overexpressing plasmid. The migration ability of cells was quantified as described above. Scale bars, 100 μM. (F) Flt1-knockdown LNT-229 cells were transfected with SHH overexpressing plasmid. Ectopic expression of SHH reverses the phosphorylation of cell invasion in Flt1-knockdown LNT-229 cells. Scale bars, 100 μM. The invasiveness ability of cells was quantified as described above. Each value was the mean ± SD of three determinations. The asterisk indicated a significant difference among the indicated comparison groups, as analyzed by Student’s t-test (**P < 0.01, ##P < 0.01). (G) Box plots show increased levels of SHH in glioblastoma (right) compared with normal brain tissues in two microarray data sets. **P < 0.01, compared with normal brain tissues was determined by the Student’s t test. (H) Kaplan-Meier analysis of overall survival of glioblastoma patients stratified by the expression of SHH. The overall survival times in the low (green, n = 134) and high Flt1 (red, n = 14) groups, with a hazard ratio of 2.33 (95% confidence interval (CI) 1.19-4.59) and P = 0.01.
