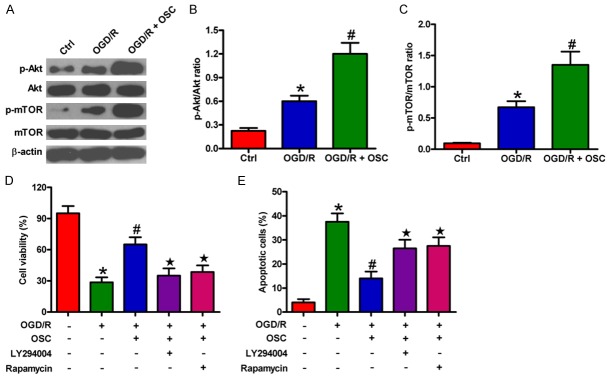
Figure 6.
OSC promoted OGD/R-treated BV-2 cell survival by further activating the PI3K/Akt/mTOR pathway. (A-C) BV-2 cells were exposed to OGD for 3 h followed by 24 h of reoxygenation. OSC (3 μM) was added to the medium immediately after OGD phase. (A) Western blot was performed to analyze the expression of Akt, p-Akt, mTOR, and p-mTOR. β-actin was used as the loading control. (B and C) Quantitative ratios of p-Akt/Akt (B) and p-mTOR/mTOR (C). (D and E) BV-2 cells were exposed to OGD for 3 h followed by 24 h of reoxygenation with or without 30 min of pre-treatment of PI3K/Akt inhibitor LY294002 (10 μM) or mTOR inhibitor rapamycin (30 nM). OSC (3 μM) was added to the medium immediately after the OGD phase. (D) MTT assay was adopted to detect cell viability. (E) Cell apoptosis was measured by flow cytometry. Data are derived from three independent experiments and expressed as means ± SD. *P < 0.05 vs. Ctrl group; #P < 0.05 vs. OGD/R group; ★P < 0.05 vs. OGD/R + OSC group.

