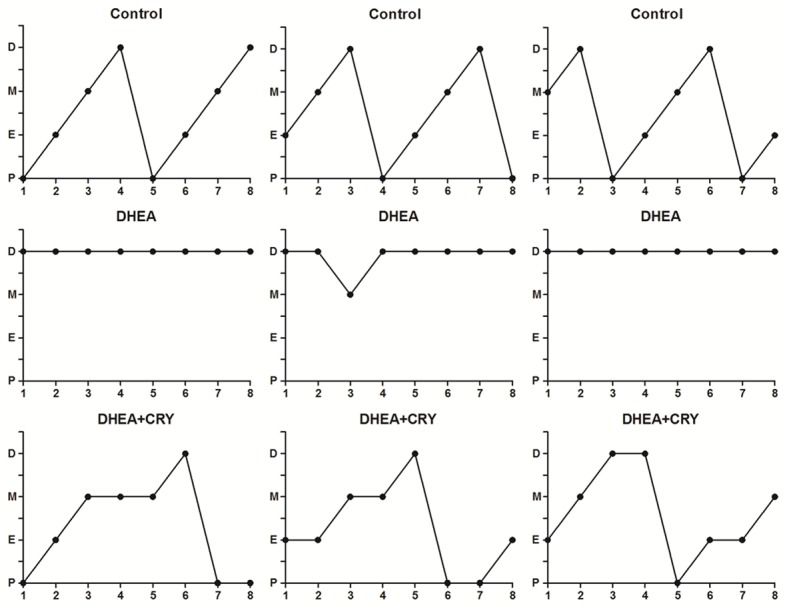
Figure 2.

Estrous cycle pattern in the three groups. Vaginal cytology was done every day starting at 3 weeks of life till the end of the study. Data presented are from the last week of the study. The figure shows pattern of three representative rats in each group including control, DHEA and DHEA + CRY. Estrous cyclicity was evaluated as the percentage of the time in each phase. P: proestrus; E: estrus; M: metestrus; and D: diestrus.
