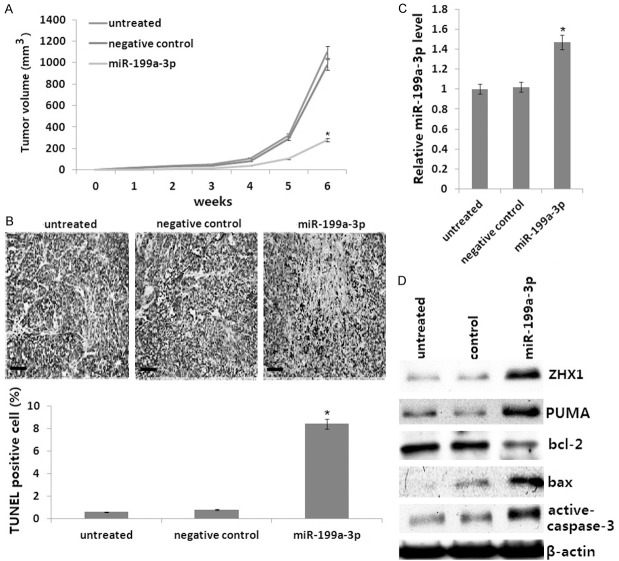
Figure 4.
Effect of the miR-199a-3p mimic onxenografted HepG2 tumor growth in vivo. A. Representative growth curves of tumor volume. B. Tissue apoptotic cells measured by TUNEL assay. C. miR-199a-3p mimic mRNA was detected by qRT-PCR. D. ZHX1, PUMA cleaved, bcl-2, BAX, and active-caspase-3 protein were detected by Western blot assay. Data represent the mean and the standard deviation (n=6). The p values were calculated with the Student’s t-test. *P<0.01.

