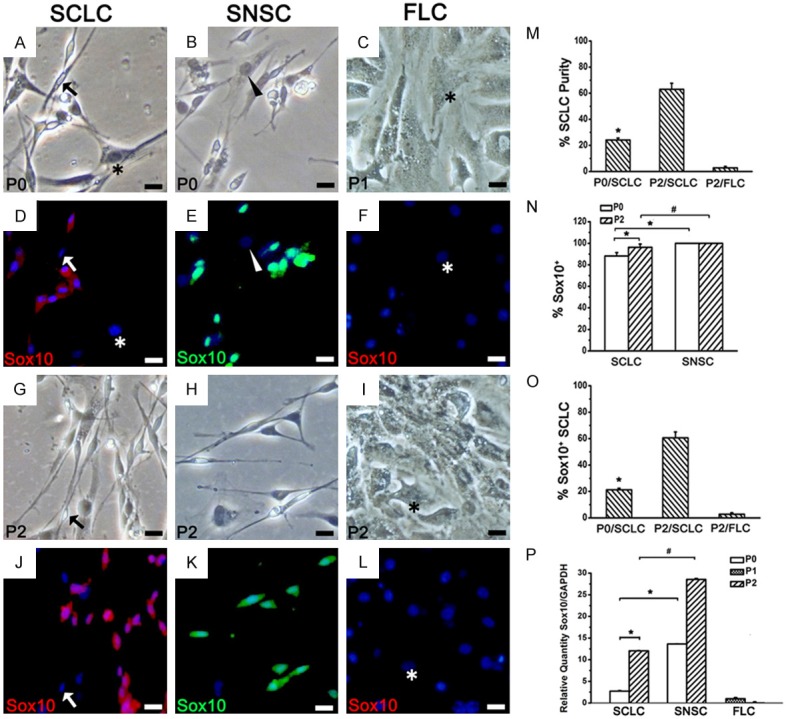
Figure 3.

Phenotypic identification of SCLC by Sox10 immunofluorescent staining. (A-C, G-I) Bright field view of SCLCs, SNSCs in P0 and P2 and FLCs in P1 and P2. (D-F, J-L) Sox10 staining of (A-C) and (G-I) Blue: DAPI. In P2, a few SCLCs were Sox10- (J, arrow), while all SNSCs stably expressed Sox10 (E, K). All FLCs (asterisk) and fibroblasts (arrowhead) were Sox10-. (M) SCLC purity in P0 and P2 adipose-derived total adherent cells. (N) Percentage of Sox10+ cells in P0 and P2 total spindle-shaped cells. (O) Percentage of Sox10+ SCLC (i.e. SC purity) in P0 and P2 total adherent cells. (P) The mRNA expression levels of Sox10 were detected using real-time RT-PCR in the three groups. *P < 0.05, #P < 0.05. Bar = 20 μm.
