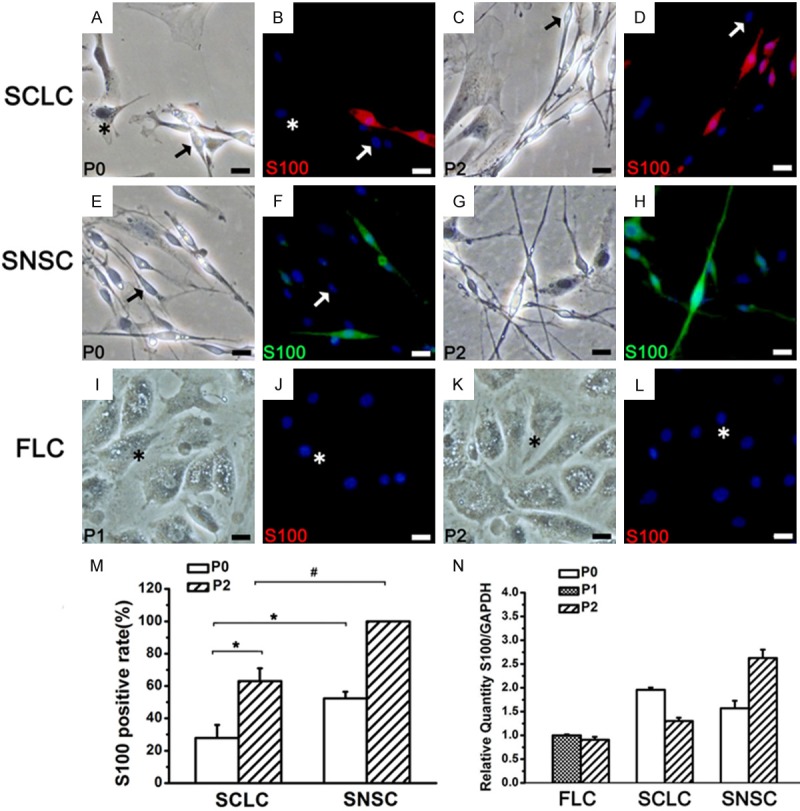
Figure 4.

The expression of S100 in SCLC, SNSC and FLC. In P0, some SCLCs and SNSCs were S100- (A, B, E, F arrow). In P2, a part of SCLCs were still S100- (C, D arrow), while all SNSCs expressed S100 (G, H). All FLCs (asterisk) were negative. P1 and P2 FLCs from adipose tissue were S100- (I-L). Blue: DAPI. (M) The percentage of S100+ in SCLC and SNSC. (N) The mRNA expression levels of S100 in the three groups. *P < 0.01, #P < 0.01. Bar = 20 μm.
