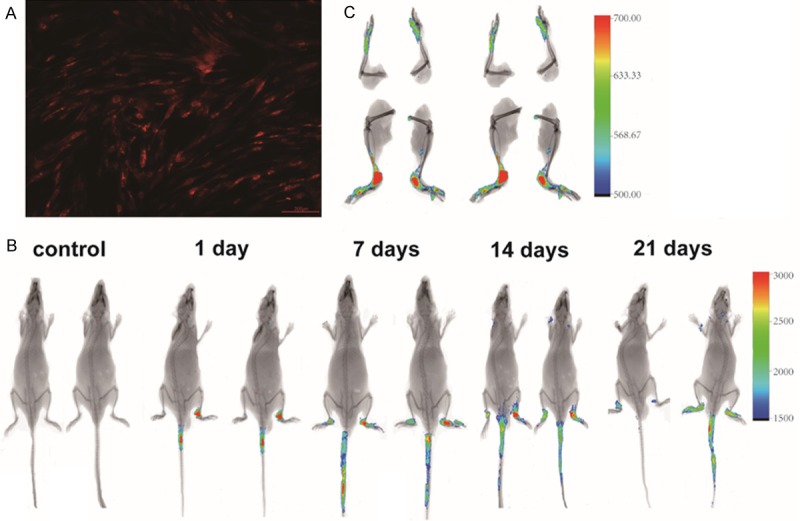
Figure 4.

Biodistribution of hASCs in CIA mice. hASCs were intravenously injected into CIA mice (n=3) and imaged on days 1, 7, 14, and 21 post injection. A: hASCs transduced with RFP in vitro. B: The fluorescence signal quantified over time was detected in the ankle joints on days 1, 7, 14, and 21. C: Following mouse sacrifice, the fluorescence activity can be seen to be localized to the ankle joints.
