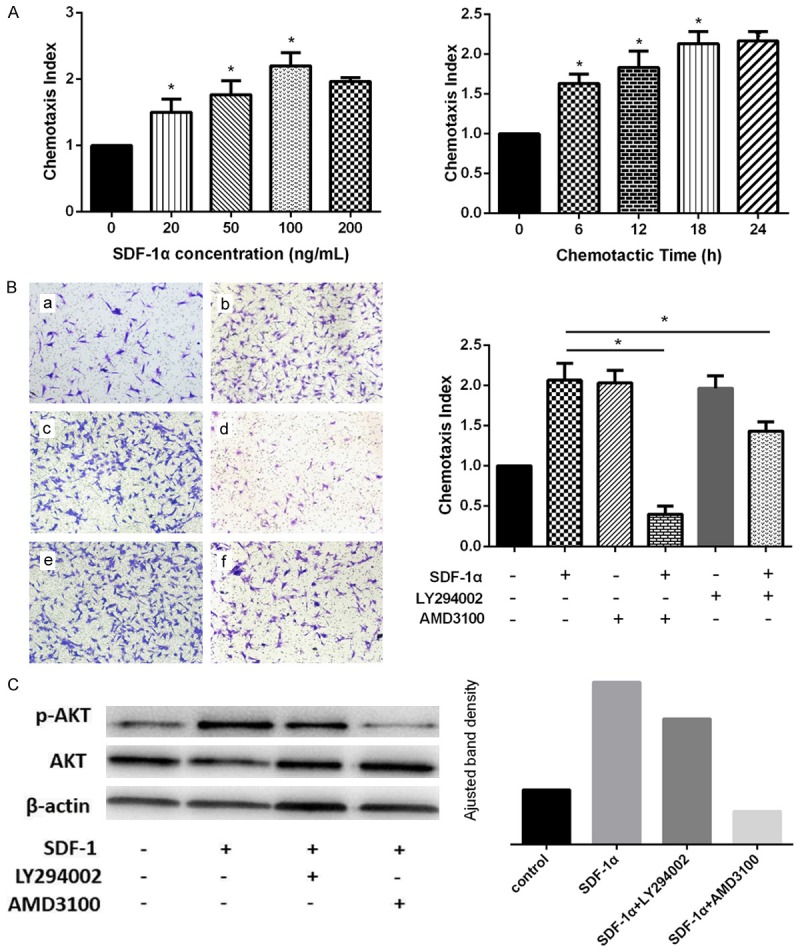
Figure 1.

Effect of SDF-1α on SDSCs migration and Akt expression. (A) Effect of SDF-1α on SDSCs migration with different doses and time. *P<0.05 versus control group. (B) Effect of SDF-1α on SDSCs were detected by transwell migration assay. a) Control group, b) SDF-1α (100 ng/ml) group, c) AMD3100 group, d) SDF-1α+AMD3100 group, e) LY294002 group, f) SDF-1α+LY294002 group. *P<0.05. Magnification: 100×. (C) With LY294002 and AMD3100, effect of SDF-1α on phospho-Akt expression was detected by western blot analysis at both phosphorylation and total protein levels. ImageJ software was used to quantifiy the bands.
