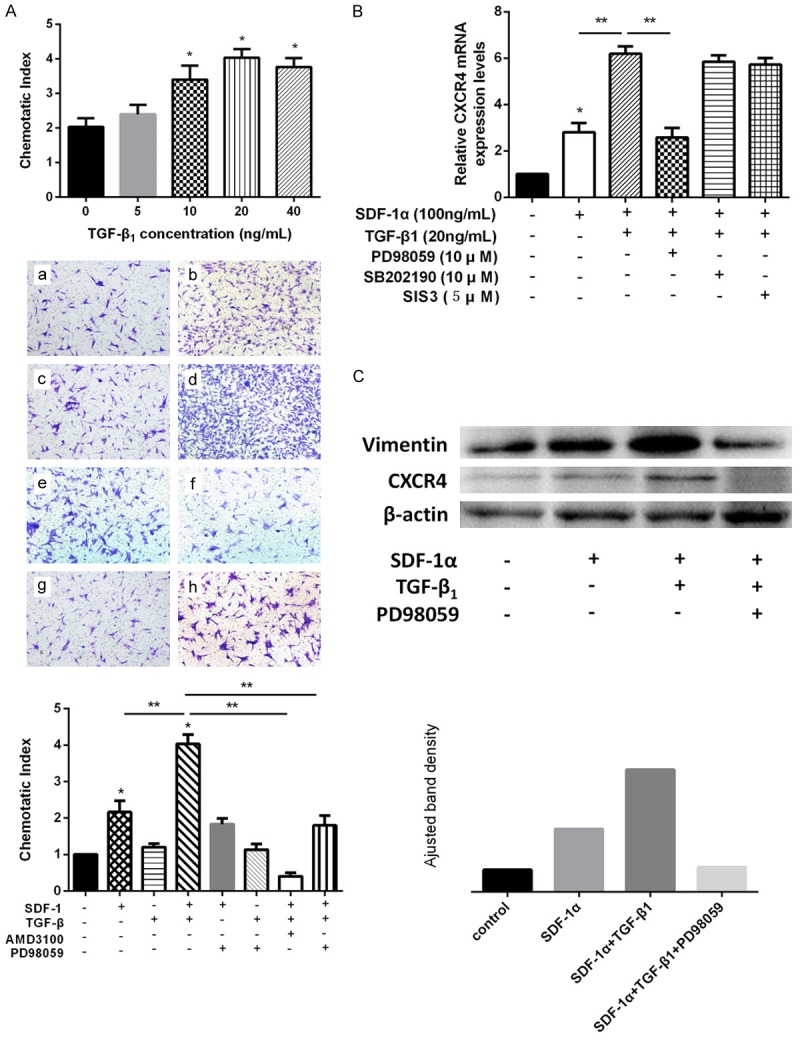
Figure 2.

Effect of TGF-β1 on SDF-1α-induced SDSCs migration and Vimentin and CXCR4 expression. (A) Effects of different concentrations of TGF-β1 on SDF-1α (100 ng/ml)-induced SDSCs migration and with ERK inhibitor PD98059, effect of TGF-β1 on SDF-1α-induced SDSCs migration were detected by transwell migration assay. a) control group, b) SDF-1α (100 ng/ml) group, c) TGF-β1 (20 ng/ml) group, d) SDF-1α+TGF-β1 group, e) SDF-1α+PD98059 group, f) TGF-β1+PD98059 group, g) SDF-1α+TGF-β1+AMD3100 group, h) SDF-1α+TGF-β1+PD98059 group. *P<0.05 compared with control group. **P<0.05. Magnification: 100×. (B) With PD98059, SB202190 or SIS3, effect of TGF-β1 on SDF-1α-induced SDSCs migration was detected by qRT-PCR *P<0.05 compared with the control group. **P<0.05. (C) With PD98059, effects of SDF-1α and TGF-β1 on Vimentin and CXCR4 expression were detected by western blot analysis. ImageJ software was used to quantifiy bands.
