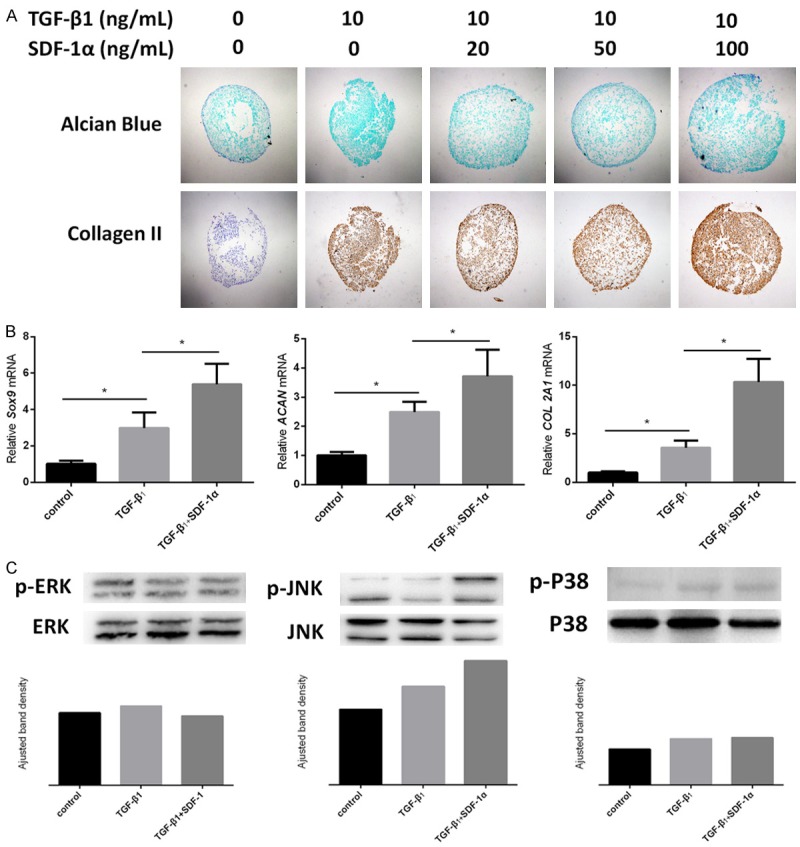
Figure 3.

Effect of SDF-1α on TGF-β1-induced SDSCs chondrogenic differentiation. (A) Effects of different concentrations of SDF-1α on TGF-β1 (10 ng/ml)-induced SDSCs chondrogenesis were detected by Alcian blue for sulfated GAGs and immunohistochemical staining for collagen II. Magnification: 40×. (B) qRT-PCR was used to evaluate chondrogenic marker gene expressions (Sox9, ACAN and COL2A1) *P<0.05. (C) Western blot was used to detect the MAPK signals (ERK, JNK and P38) at both phosphorylation and total protein levels. ImageJ software was used to quantifiy bands.
